Streamflow is too low compared with the USGS observation
185 views
Skip to first unread message

Ted
Apr 29, 2022, 2:17:14 PM4/29/22
to wrf-hydro_users
Dear All,
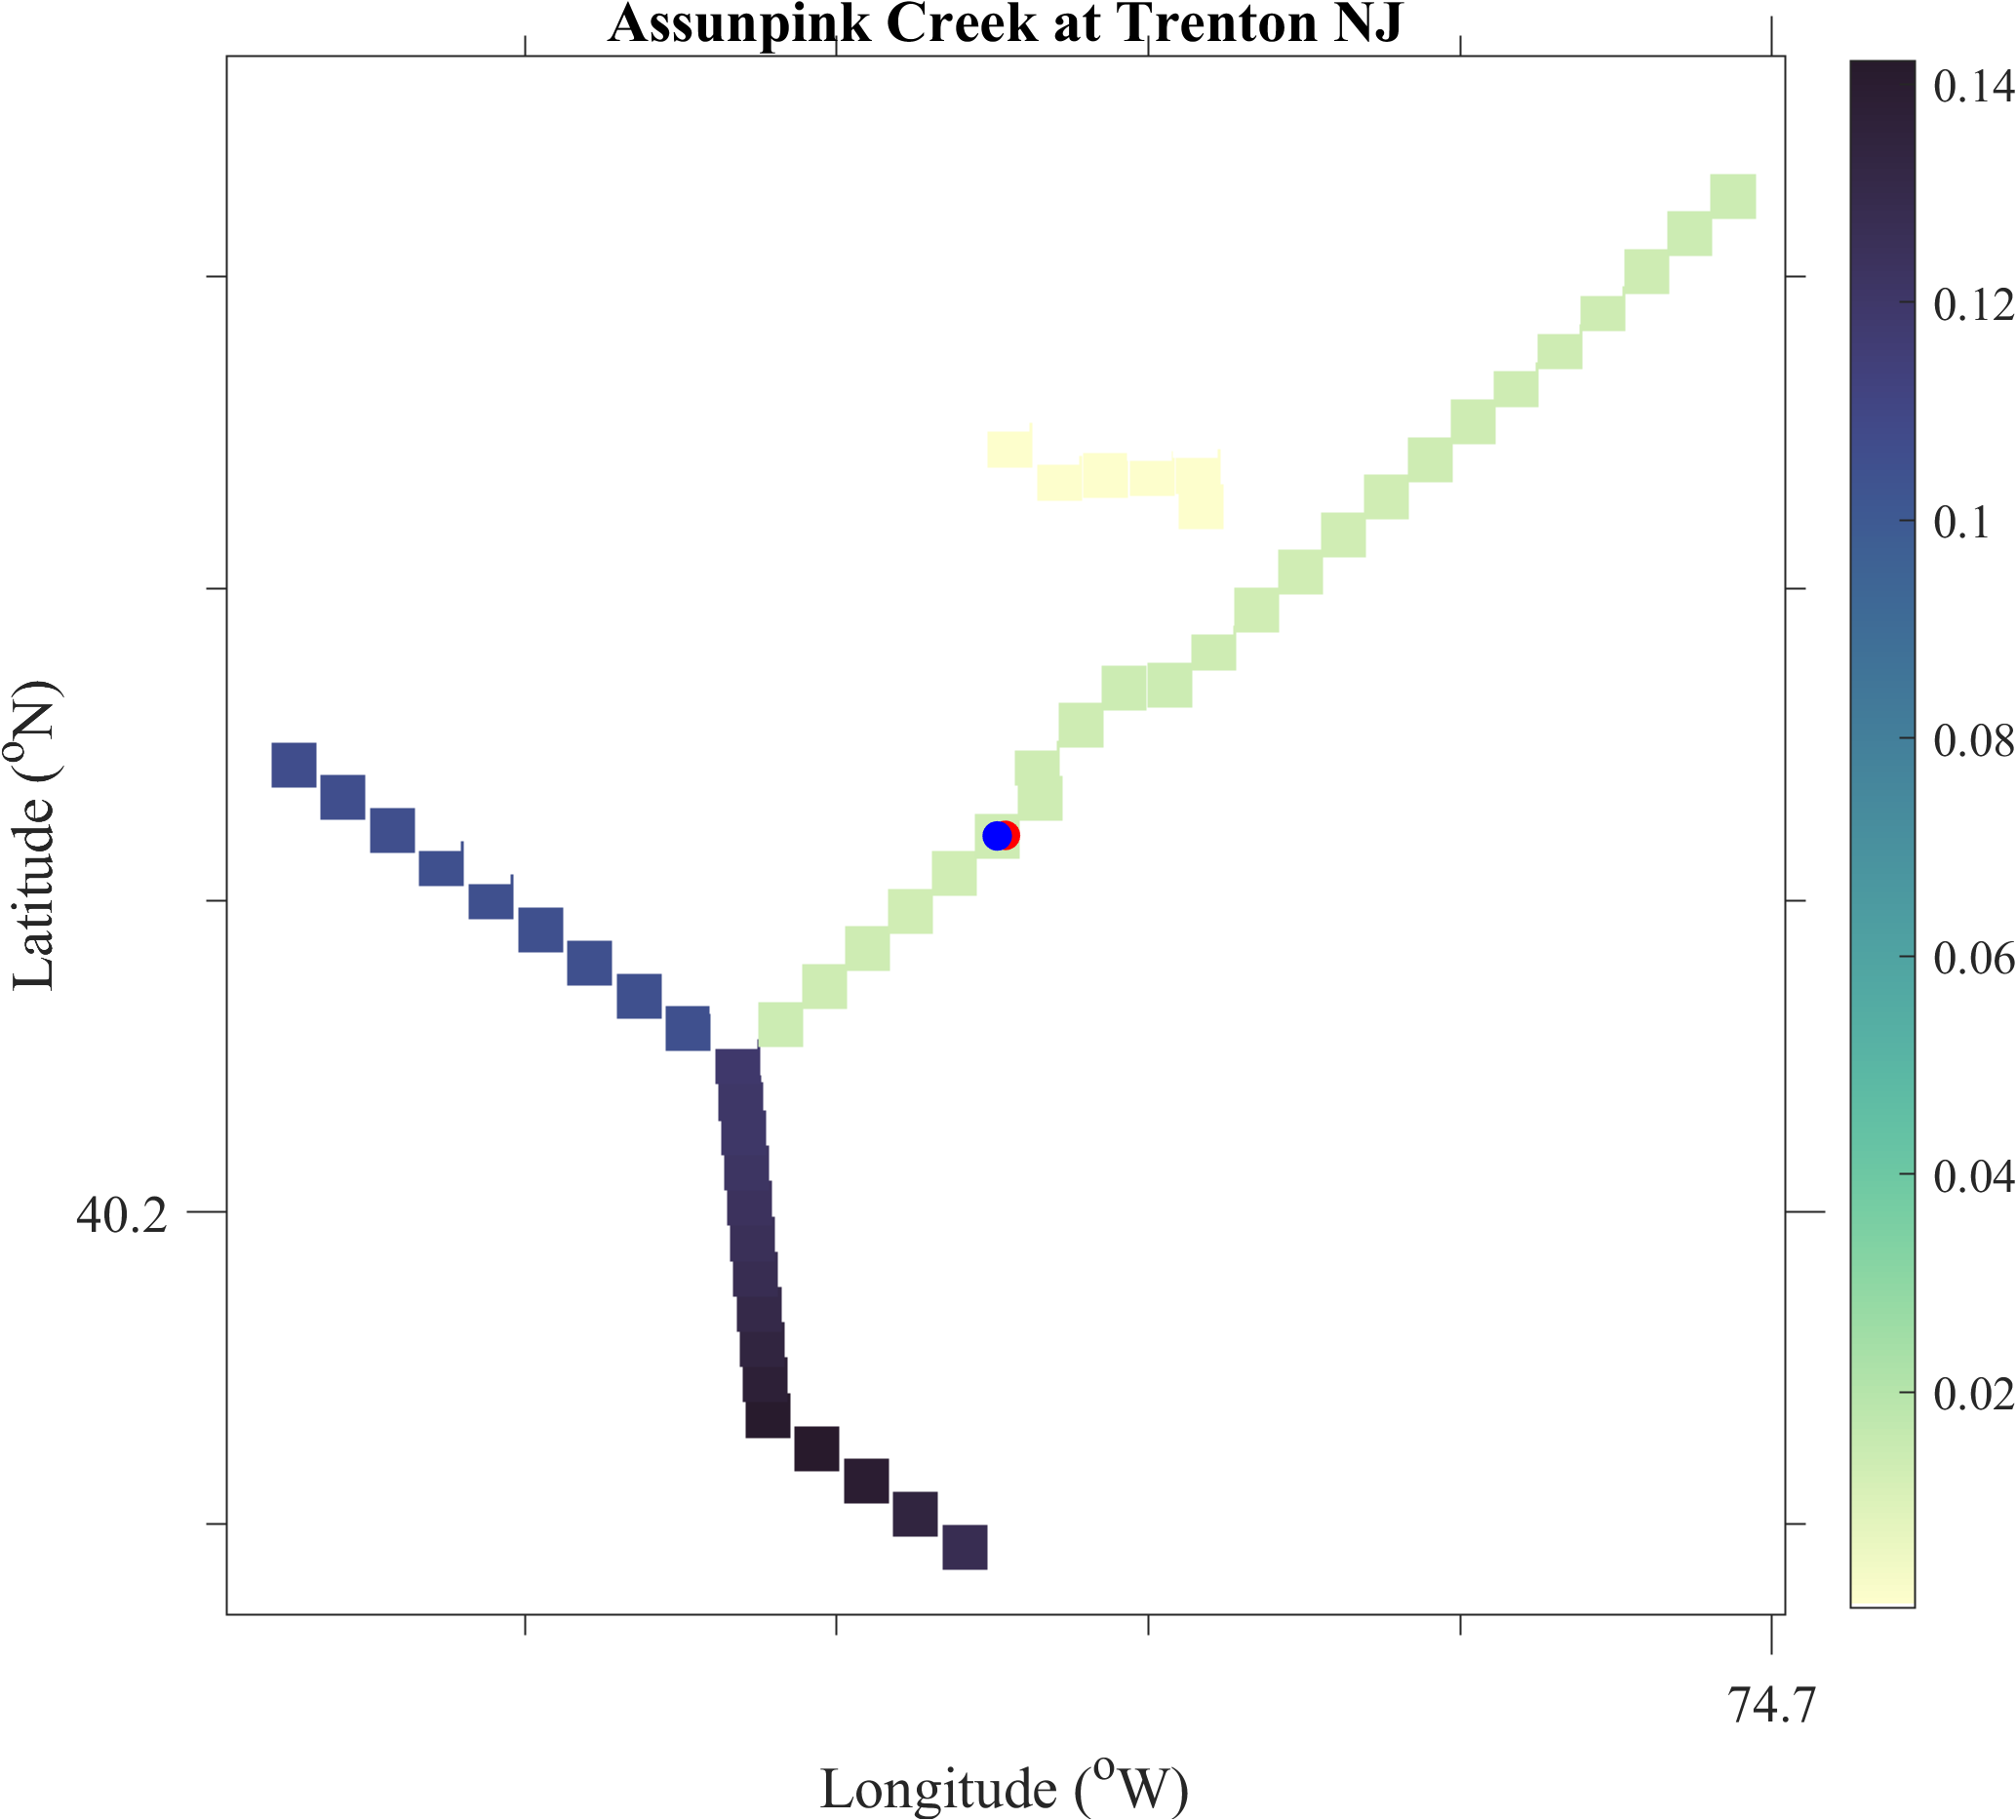
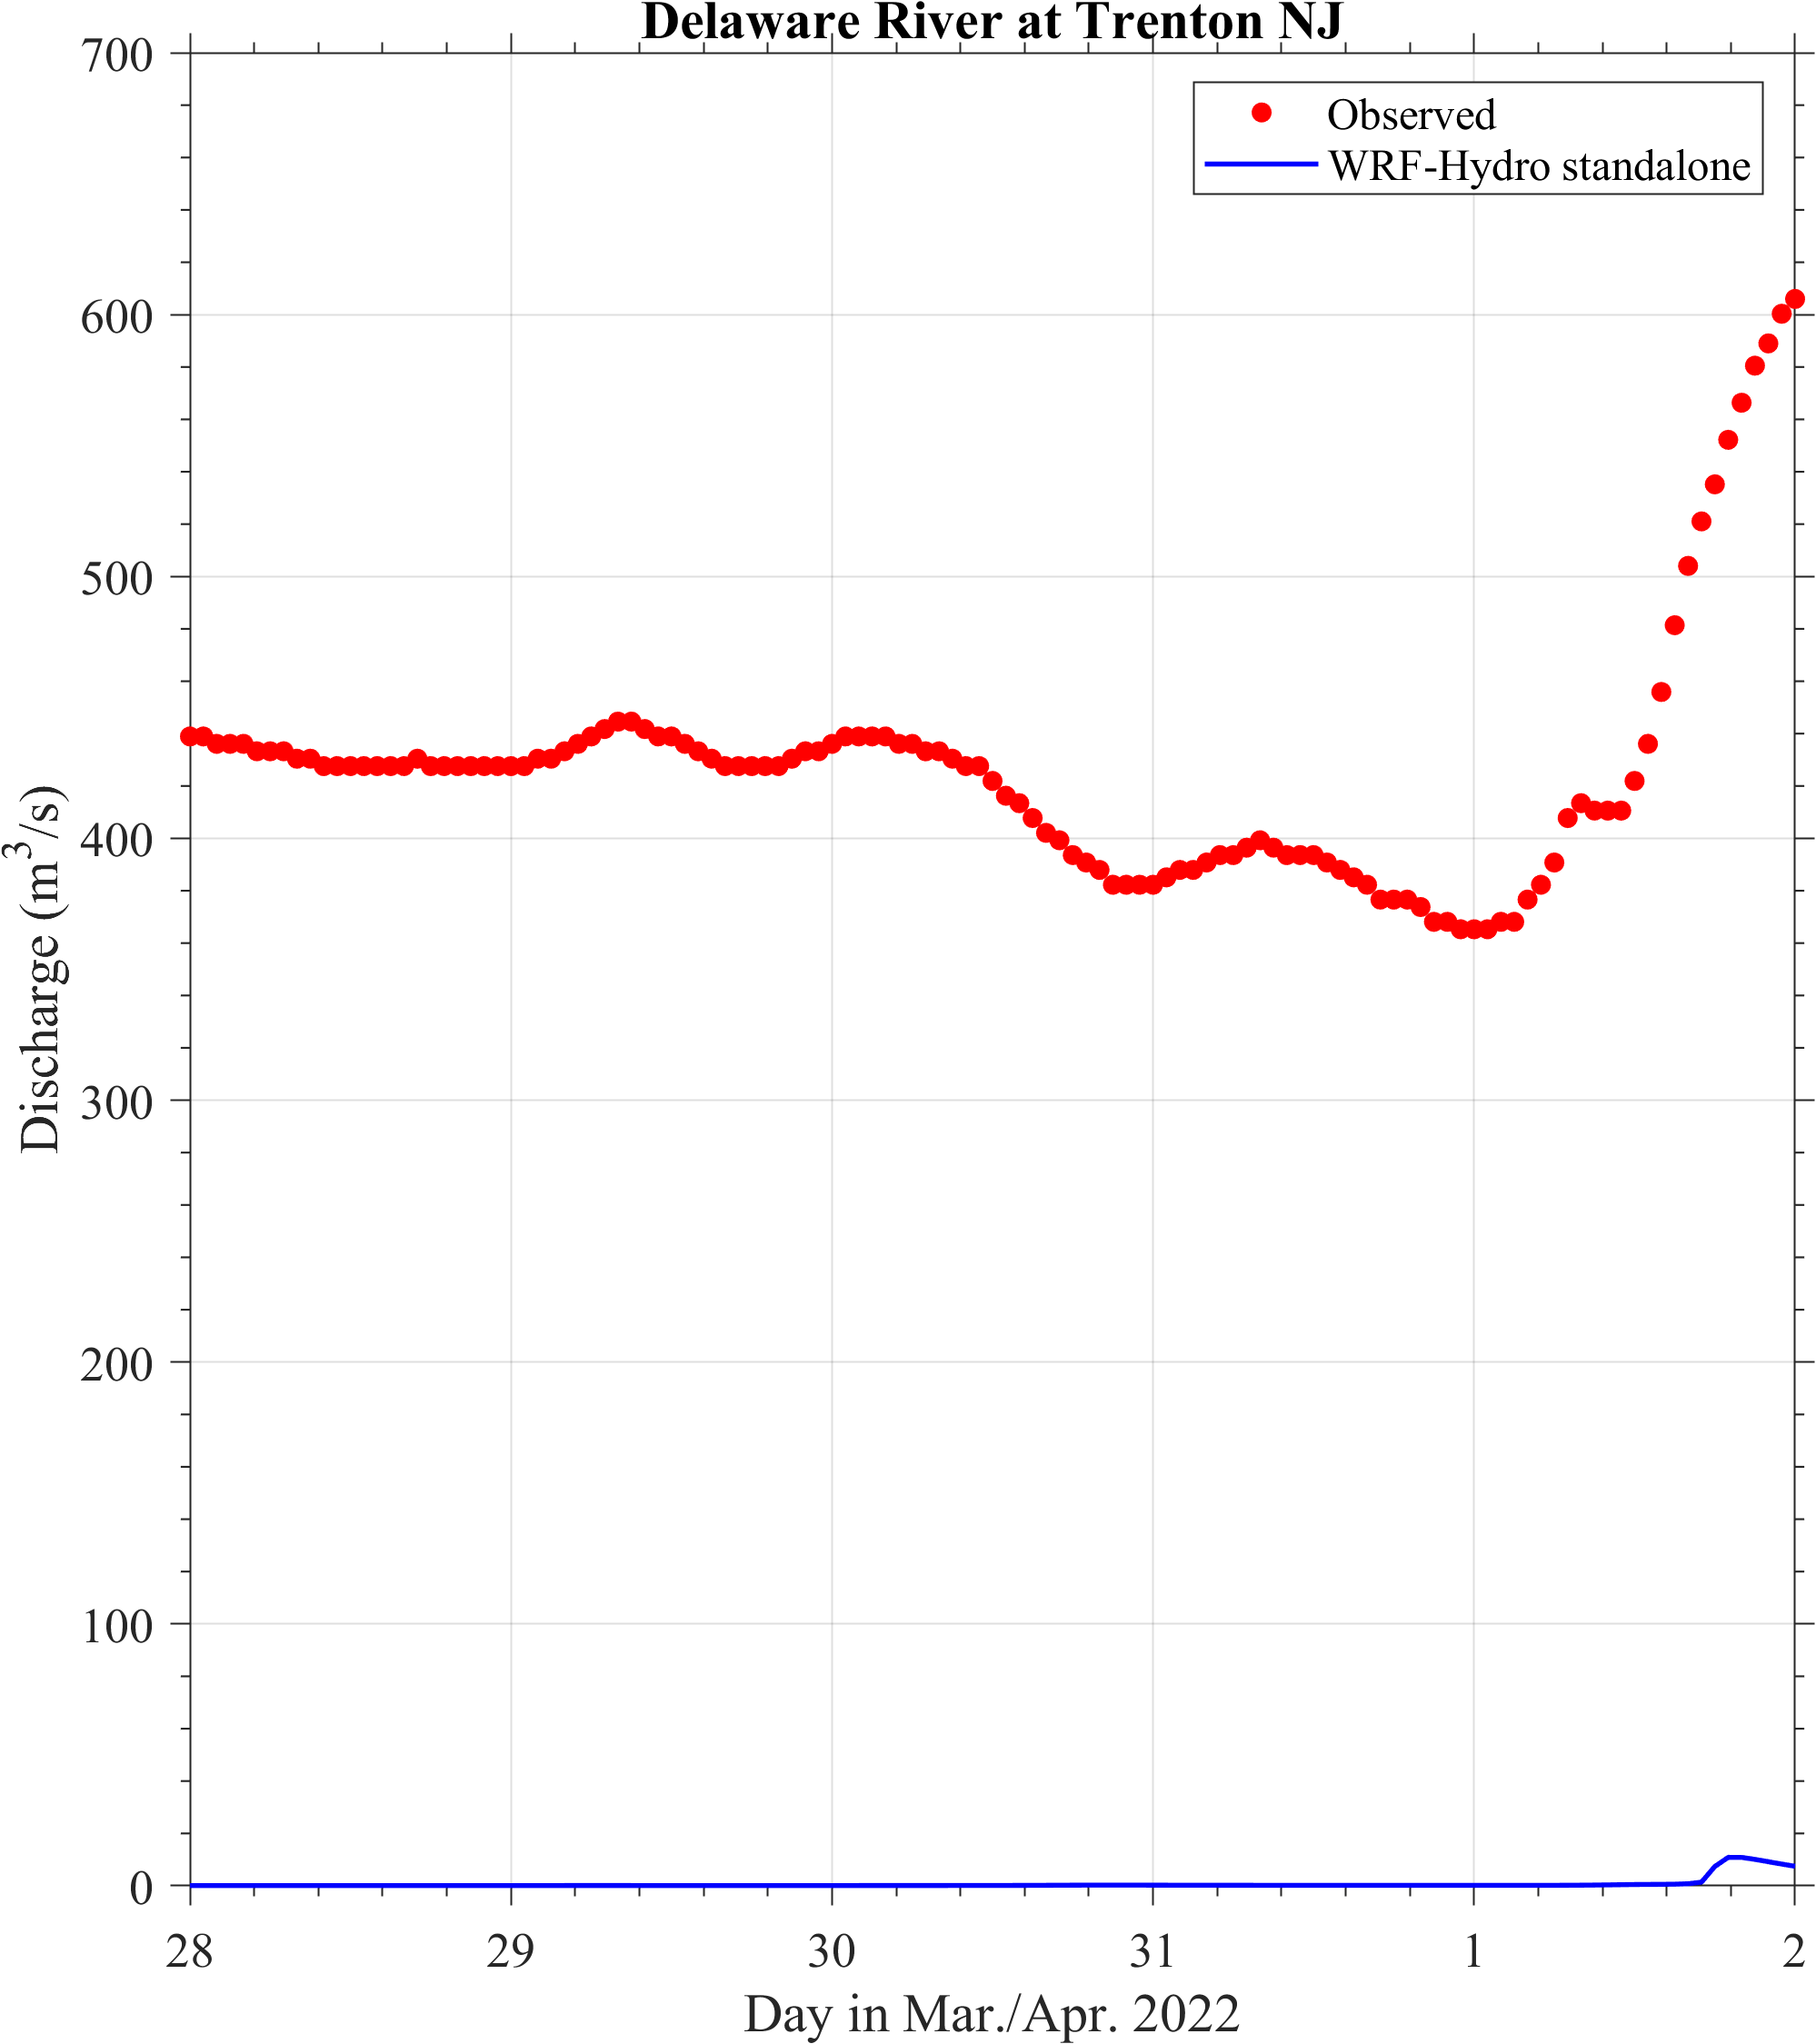
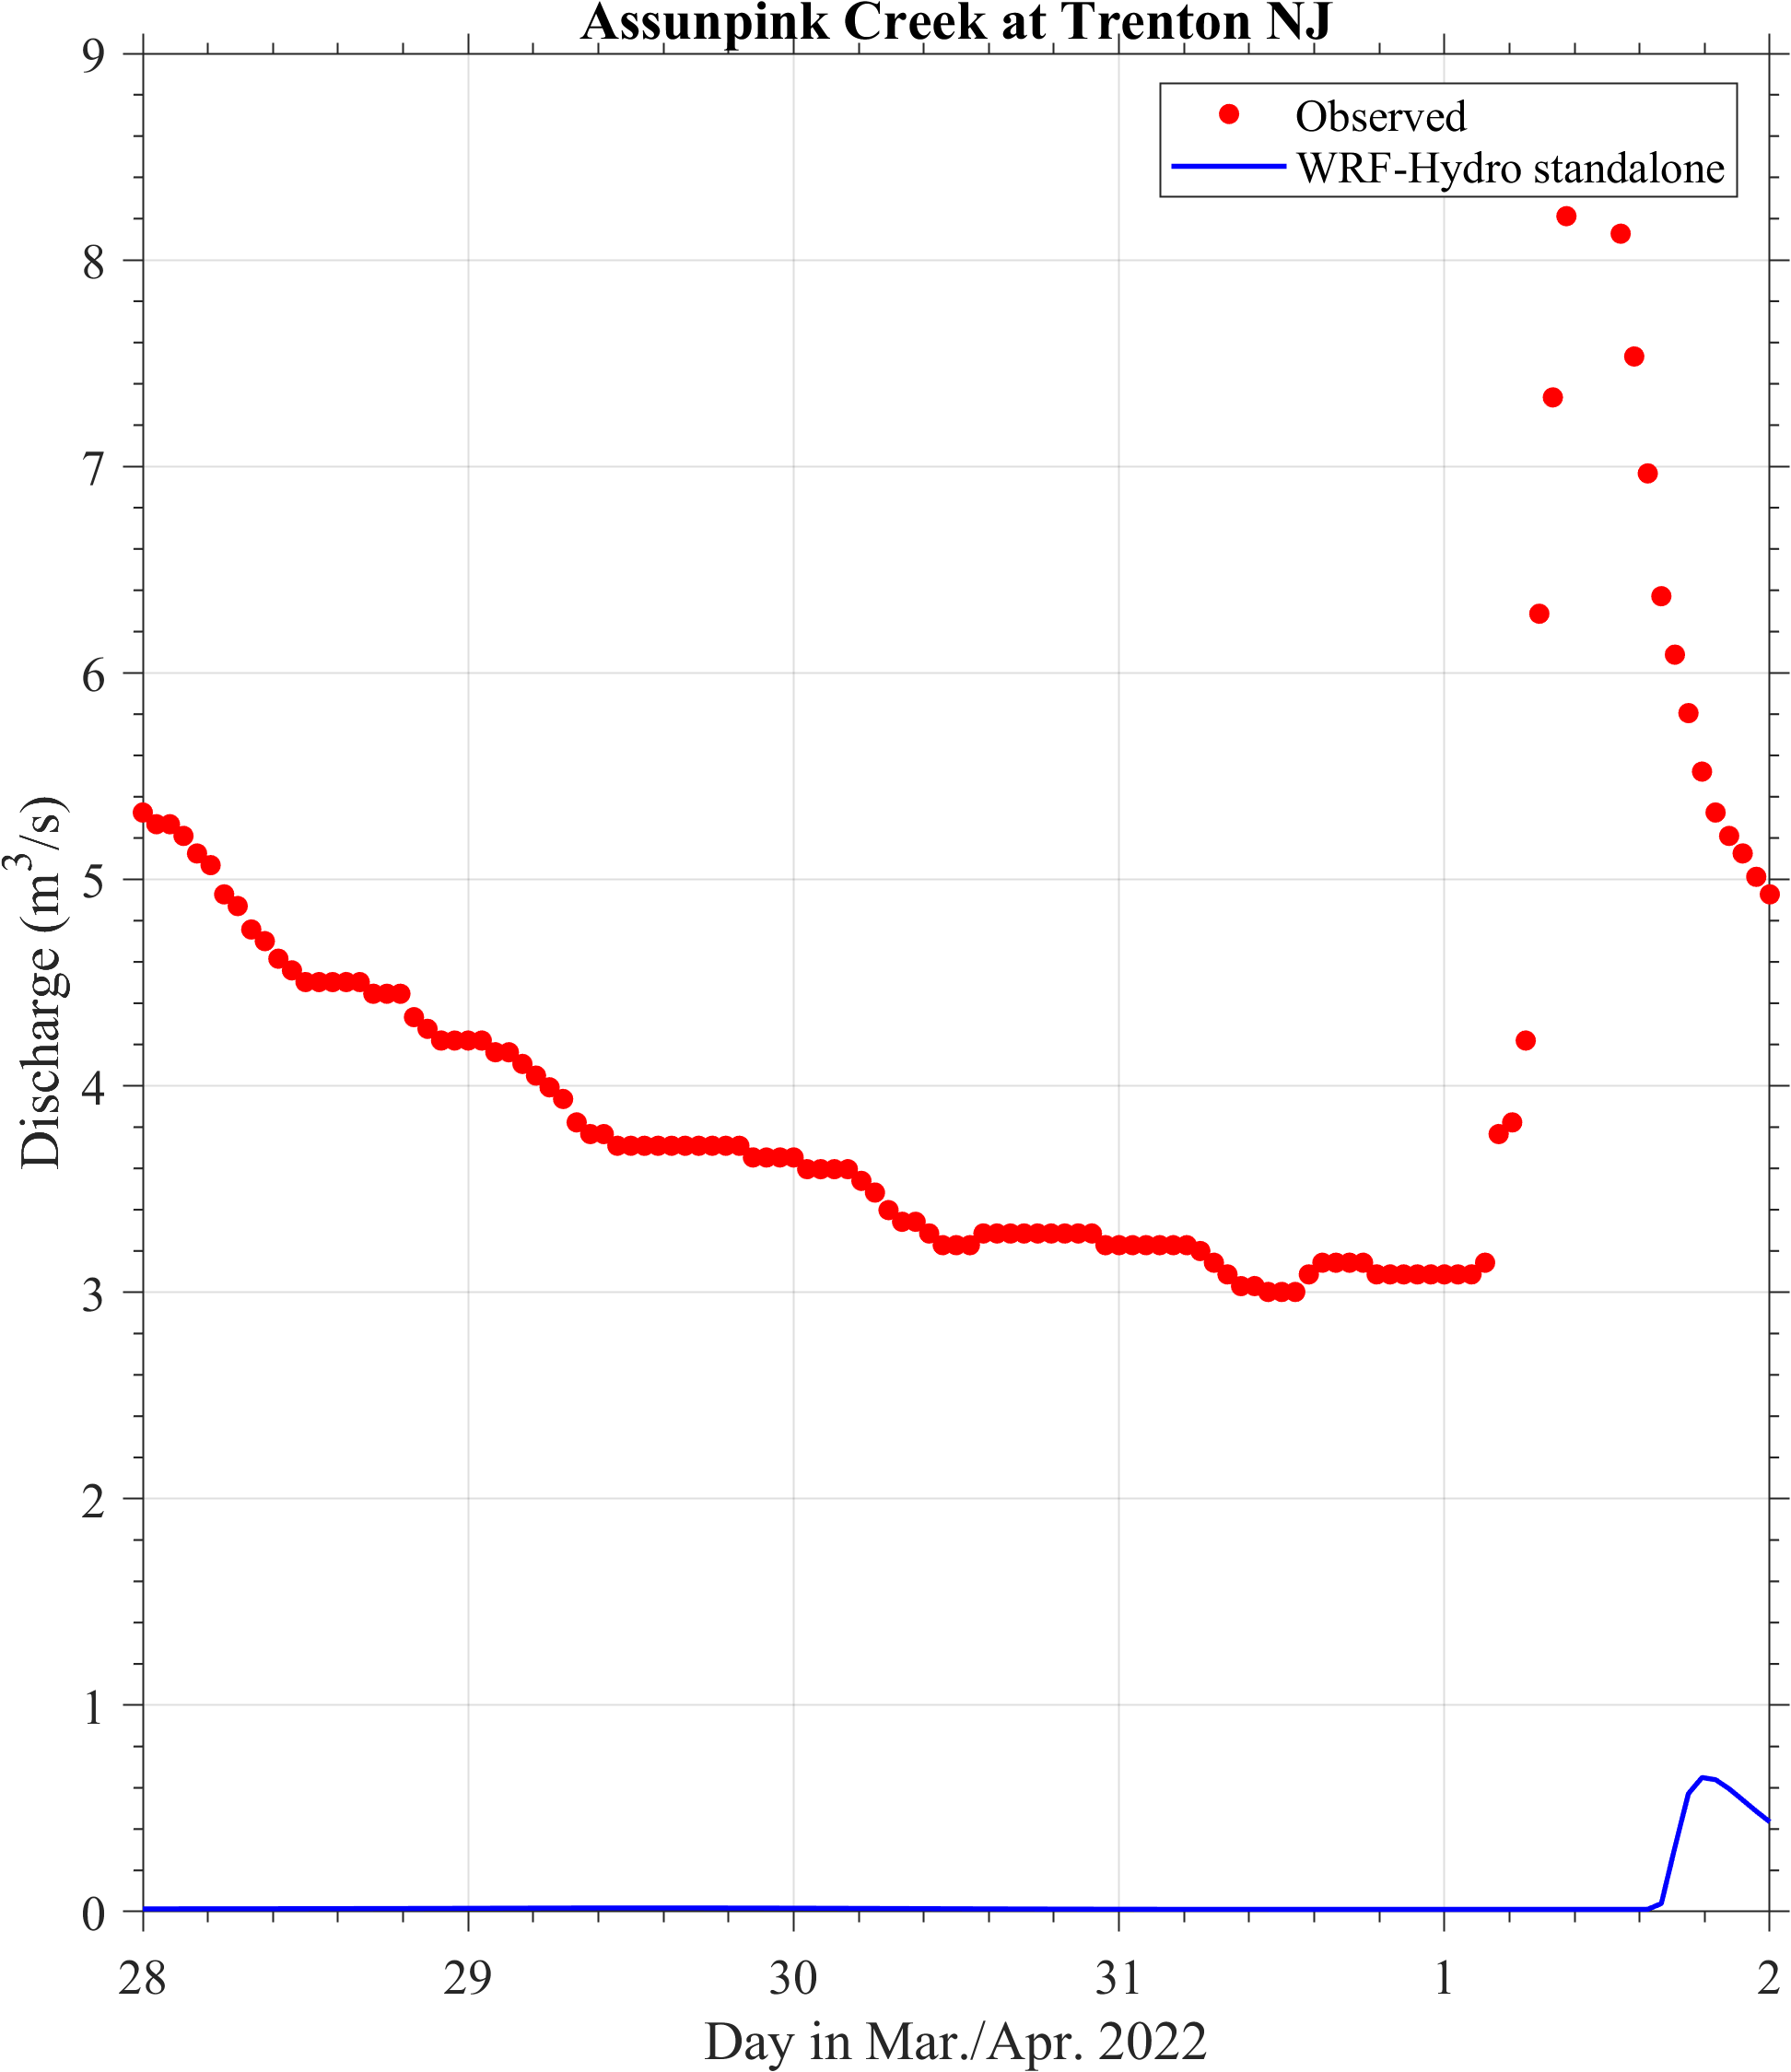
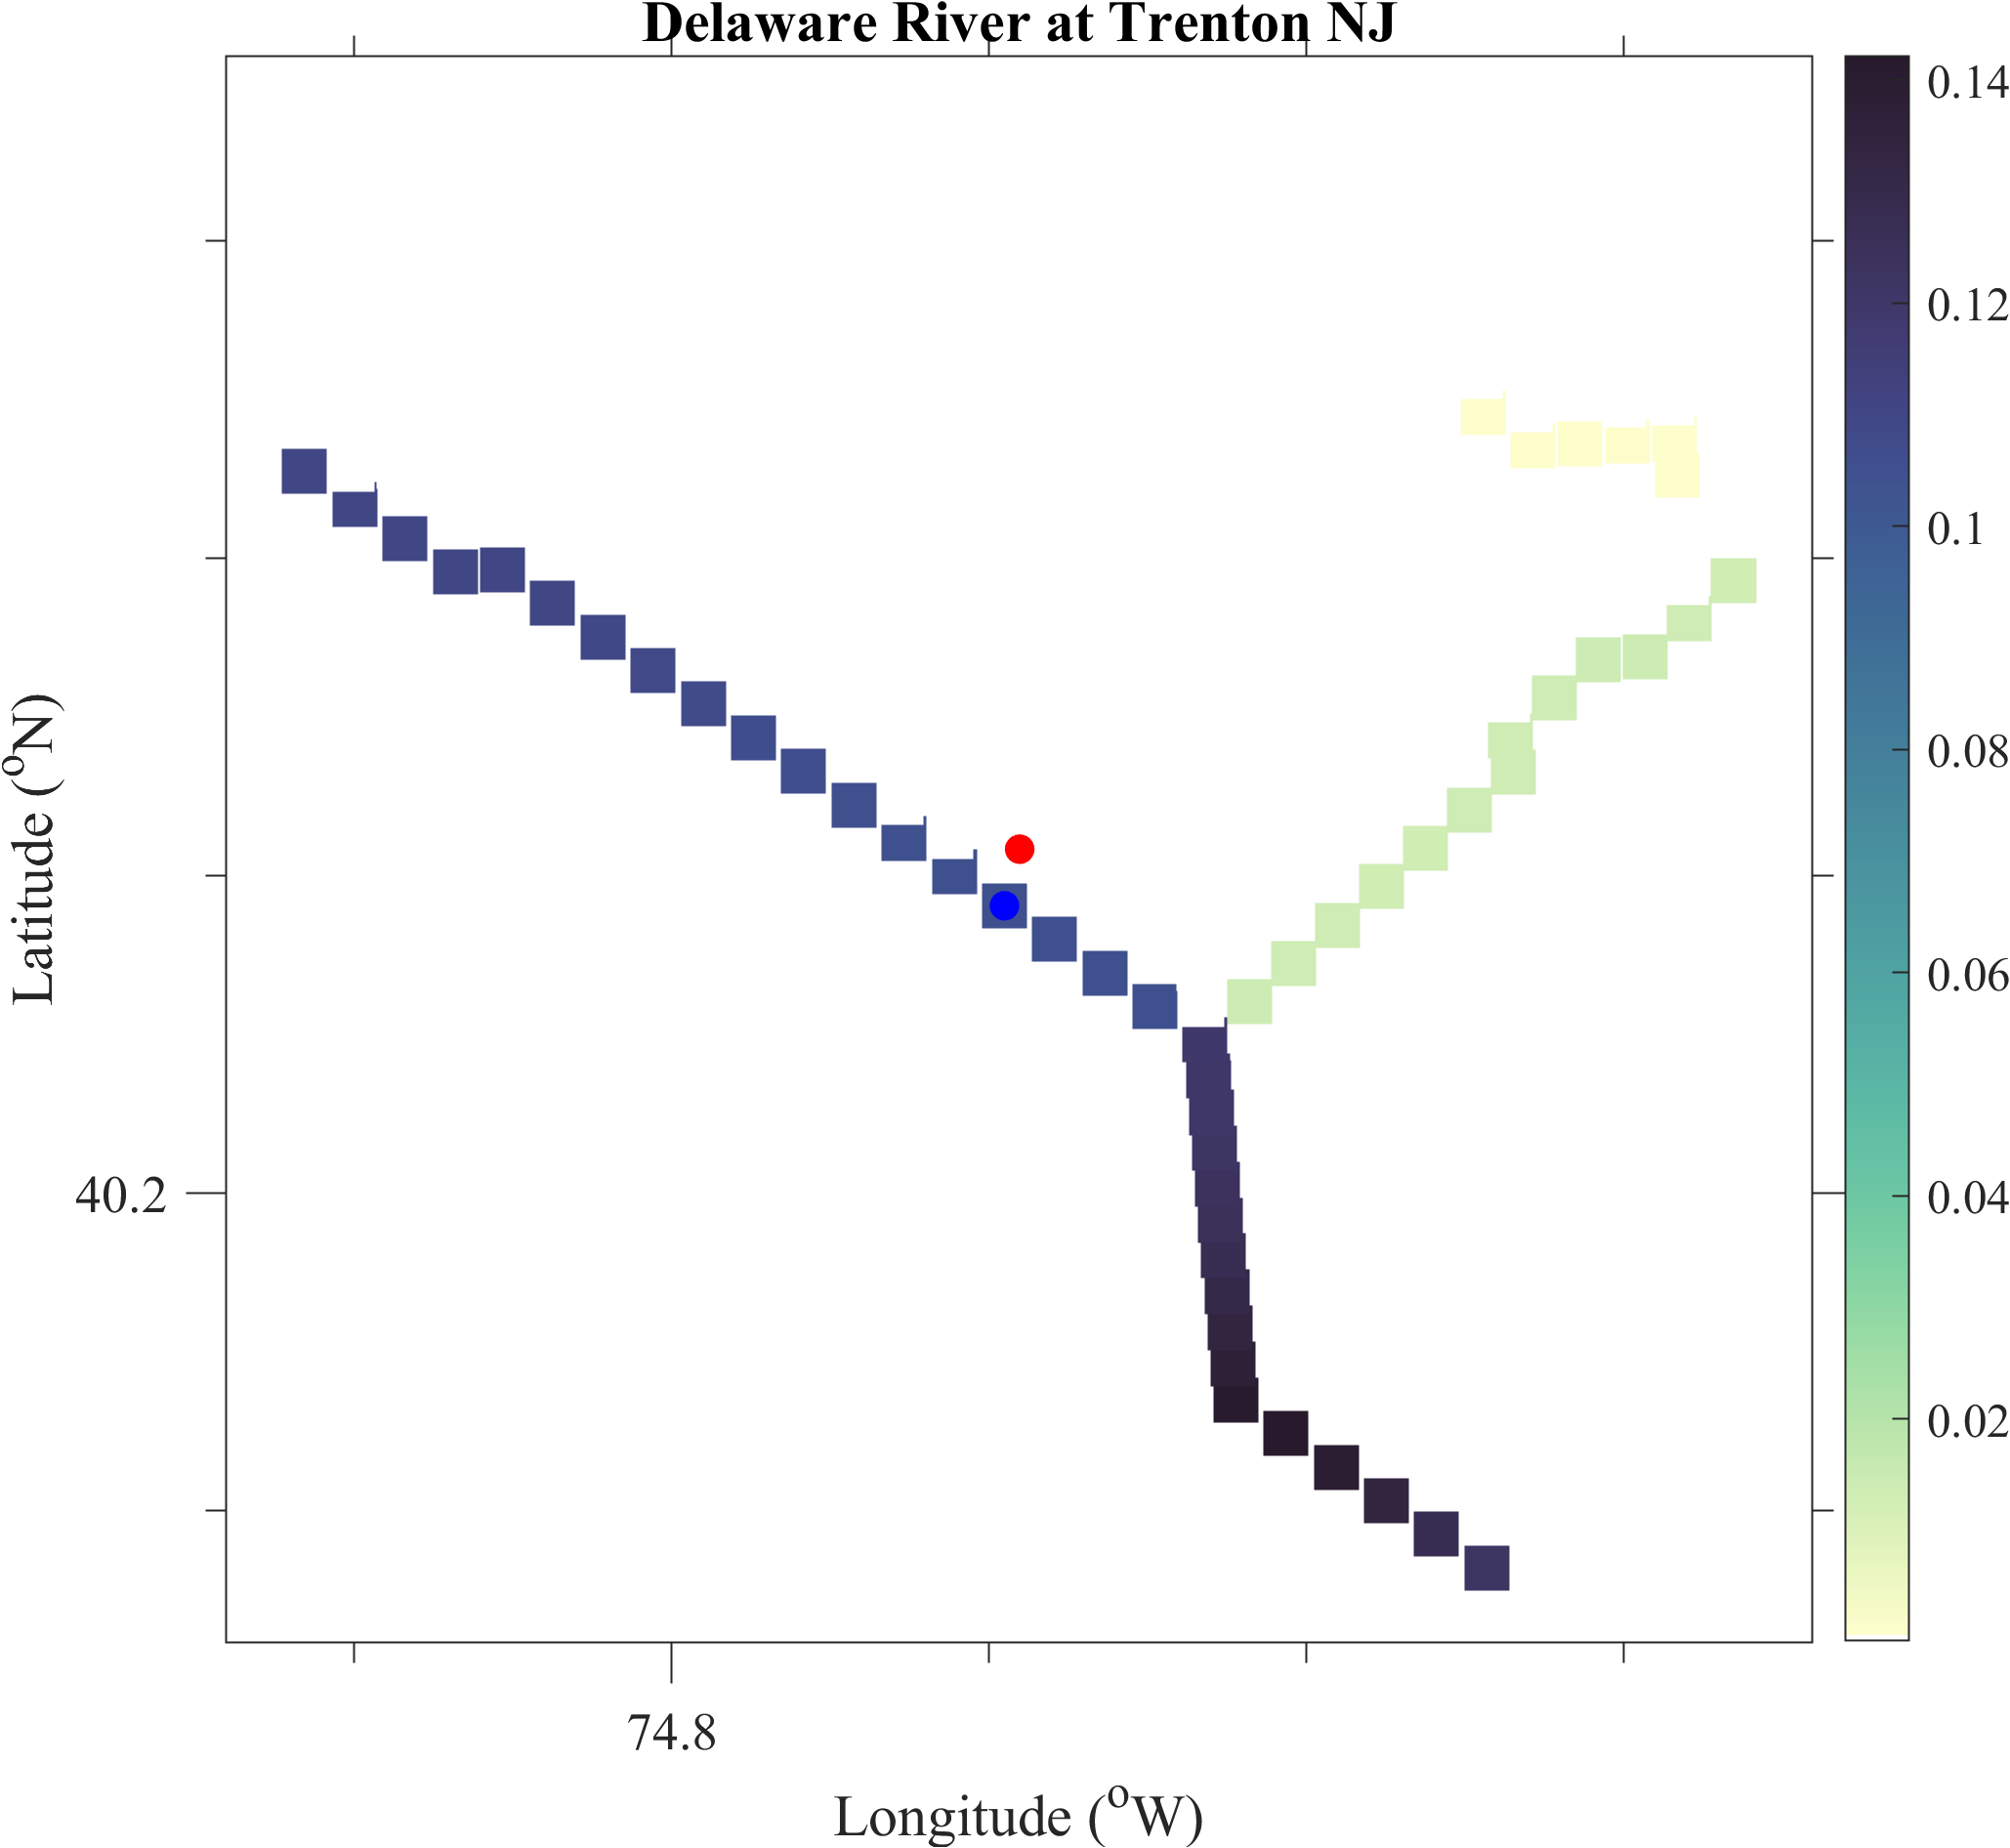
I simulate the US north-east region with WRF-hydro standalone. I compared my model results with USGS observations. I found that the simulated streamflow is much lower than the observed (Please see the attached figures). The discharge at Delaware River station is ~400 m^3/s, but is less than 1 in my results.
I used NoahMP land model. I used my WRF outputs as inputs and included precipitation hourly. I also attached my namelist files.
Does anyone have any idea about this problem?
Thanks.
Ted

Kevin
May 2, 2022, 1:55:09 PM5/2/22
to wrf-hydro_users, Ted
Ted,
Cheers,
Kevin
I answered this question via direct message, but I wanted to provide some feedback here for other users experiencing similar results. After looking at your domain configuration, I think the problem is that your simulated basin are for the Delaware River is far too small. It appears that the DEM that was used in the GIS Pre-processing tools was too coarse resolution, resulting in some hydrographic artifacts and a very limited drainage area for your intended basin. The solution should be to use an appropriate resolution for your input high-resolution DEM (such as 90-250m). Be sure to check the FLOWACC, CHANNELGRID, and basn_msk grids in the outputs to make sure that the hydrography in your simulation matches reality. Also, a longer spin-up period may be necessary to warm up the land surface in your simulation.
Cheers,
Kevin
Sujan Pal
May 20, 2022, 11:15:30 AM5/20/22
to wrf-hydro_users, Ted
I agree with Kevin. I found realistic simulated discharge at Delaware River using a larger WRF-Hydro domain and longer spin-up. You can look at my domain and model specifics over northeastern US here - https://doi.org/10.1002/essoar.10511327.1
Best,
Sujan
Ted
May 23, 2022, 1:03:35 PM5/23/22
to wrf-hydro_users, Sujan Pal, Ted
Hi Sujan,
Do you still remember how long it took to run
you case for the six-month spin-up?
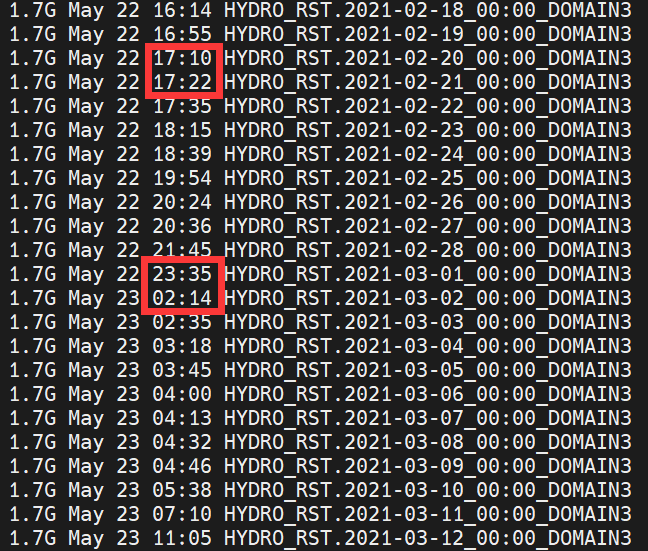
Now I am running the whole year of 2021 for spinning up. I set the output every 24 h so that it will not spend too much time on writing netcdf files. I found that sometimes the model runs ~14 min for one hour, while sometimes it could take several hours for simulating one hour. Is this normal? For example, below are the creating time of the restart files.
As is shown, in my case, it took 12 minutes to run from Feb 20 to Feb 21. However, it took almost 3h to run from Mar. 1 to Mar. 2. Have you met this problem? Thank you.
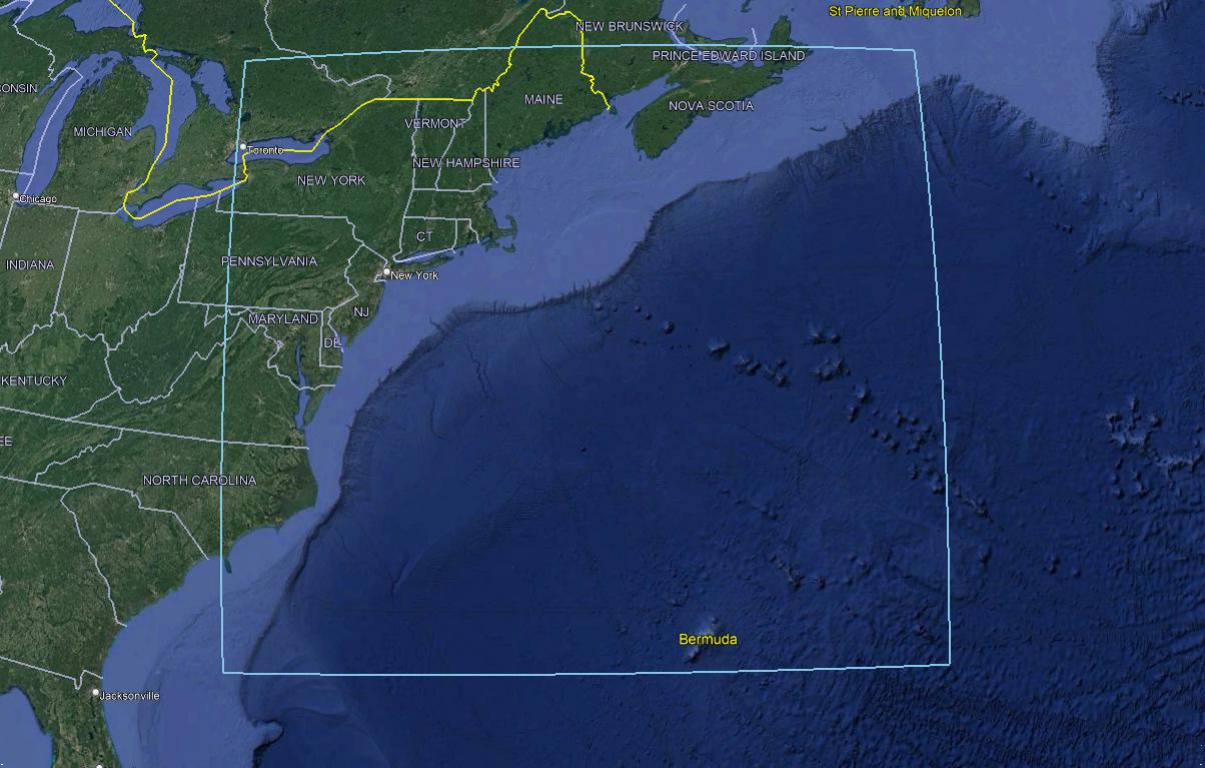
For my case, my domain is covers the similar region as yours. The WRF grid spacing is 3 km. The resolution of routing model is 250 m. The grid size is 6516 * 7380. I used 528 cores to run my job (22 nodes, with ppn of 24).
Thank you so much.
Regards,
Ted
Sujan Pal
May 24, 2022, 5:27:59 PM5/24/22
to wrf-hydro_users, Ted, Sujan Pal
Hi Ted,
I think this is possible for a large domain while converging to a numerical solution may take different times. Also, the run time depends on what types of output you are saving. For my paper, the main goal was to save 200-m inland flood depth/ surface water depth every hour which took significant amount time. Also, saving the restart files may take quite a while. One year of my simulations roughly took 1.5 days (I used 1296 cores). However for the spin-up runs, you may limit the number of restart files (maybe save every 15 days or month) and generate only the land model/ coarse resolution outputs to make it faster.
Hope this helps.
Thanks,
Sujan
Reply all
Reply to author
Forward
0 new messages