New bigBarChart settings, support for bigPsl, and bigBed url $<field2> links
35 views
Skip to first unread message

Brian Lee
Apr 28, 2022, 3:45:11 PM4/28/22
to track...@soe.ucsc.edu
New settings have been added to the Track Database Definition document, http://genome.ucsc.edu/goldenPath/help/trackDb/trackDbHub.html, mainly in support of bigBartChart, but also for bigPsl and bigBed.
The bigBarChart format, http://genome.ucsc.edu/goldenPath/help/barChart.html, has new settings documented in its section, http://genome.ucsc.edu/goldenPath/help/trackDb/trackDbHub.html#bigBarChart, that aid in display in the main browser and in the details page allowing dynamic selection of the bars making up a bigBarChart.
NEW BARCHART DISPLAY SETTINGS
Two new settings for bigBarChart are about adjusting the display in the browser: barChartBarMinWidth and barChartBarMinPadding.
barChartBarMinWidth: http://genome.ucsc.edu/goldenPath/help/trackDb/trackDbHub.html#barChartBarMinWidth
Sets the minimum pixel width of the bars in the chart to <num> pixels. Example: barChartBarMinWidth 10
barChartBarMinPadding: http://genome.ucsc.edu/goldenPath/help/trackDb/trackDbHub.html#barChartBarMinPadding
Sets the minimum pixel width between bars to <num> pixels. Example: barChartBarMinPadding 5
Here are two example tracks using these settings on the same source data that can be loaded by going to the My Data, Custom Tracks page and pasting the below text to see how the display differs.
browser position chr14:95,081,796-95,436,280
track type=bigBarChart barChartBarMinPadding=5 name="ex barChartBarMinPadding" description="A bigBarChart file with barChartBarMinPadding" barChartBars="adiposeSubcut breastMamTissue colonTransverse muscleSkeletal wholeBlood" visibility=pack bigDataUrl=http://genome.ucsc.edu/goldenPath/help/examples/barChart/hg38.gtexTranscripts.bb
track
type=bigBarChart barChartBarMinWidth=20 name="ex barChartBarMinWidth"
description="A bigBarChart file with barChartBarMinWidth"
barChartBars="adiposeSubcut breastMamTissue colonTransverse
muscleSkeletal wholeBlood" visibility=pack
bigDataUrl=http://genome.ucsc.edu/goldenPath/help/examples/barChart/hg38.gtexTranscripts.bb
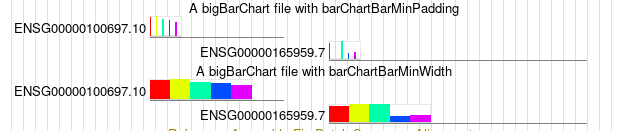
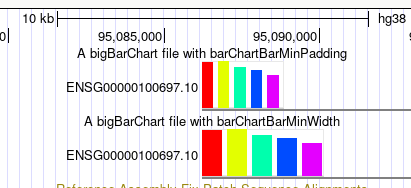
You can see the bottom track has wider widths, and the top track has larger padding between bars. As described in the settings entry, there is a dynamic calculation dependent on the current window size, the width of the item, and the number of bars for the item. So that when zooming in the appearance of the barCharts with these settings can be different, at different scales. For instance, in the first image, you can see how much impact barChartBarMinWidth has on the second track, as well as the barChartBarMinPadding in the top track. But as zoomed in, with the below image, the impact of both of these settings is less noticeable.
NEW BARCHART DETAILS SELECTION SETTINGS
Another set of new settings aid in the details page of barCharts: barChartFacets, barChartStatsUrl, and barChartMerge.
This setting turns on the faceted selection on the track details and configure page which is useful for selecting which bars out of a large number to display.
barChartStatsUrl: http://genome.ucsc.edu/goldenPath/help/trackDb/trackDbHub.html#barChartStatsUrl
This setting associates a table in tab-separated-values with the barchart, with one line per bar.
This setting enables the merge button inside of the faceted selections. It is particularly useful when there are many bars and many facets.
Here below is an example track using these settings on source data for a Tabula Sapiens single cell RNA data from many tissues track. This excerpt of settings from that track allows experimenting to see these settings in action, and be loaded by going to the My Data, Custom Tracks page.
track type=bigBarChart name="ex Tabula Sapiens" description="A bigBarChart using Tabula Sapiens data to illustrate new Details pages" visibility=pack barChartCategoryUrl=http://hgdownload.soe.ucsc.edu/gbdb/hg38/bbi/tabulaSapiens/bw_edit_tissue_cell_type.categories barChartFacets=tissue,cell_class,cell_type barChartStatsUrl=http://hgdownload.soe.ucsc.edu/gbdb/hg38/bbi/tabulaSapiens/bw_edit_tissue_cell_type.facets barChartMerge=on bigDataUrl=http://hgdownload.soe.ucsc.edu/gbdb/hg38/bbi/tabulaSapiens/tissue_cell_type.bb
Once loaded, click into an item to see the details page, in this case for the gene ACE2 at the default position in hg38. Click the first two "merge" buttons next to "tissue" and "cell_class."
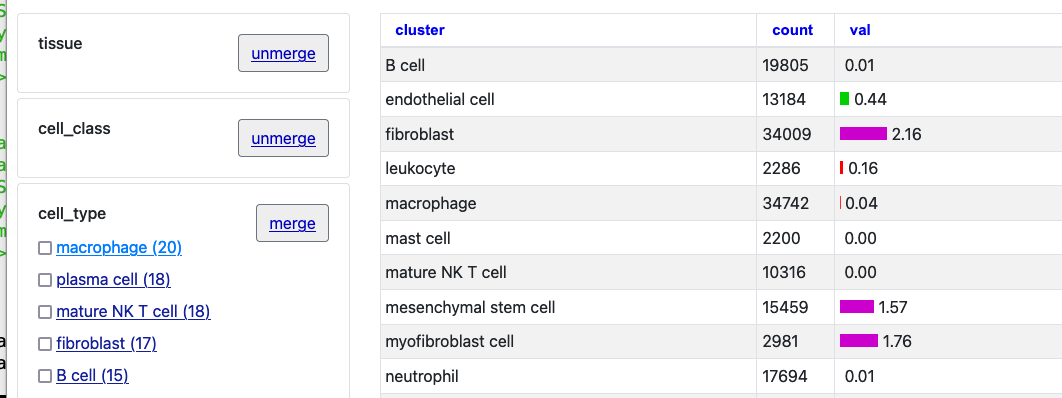
Now click "Macrophage" to see just one selection.
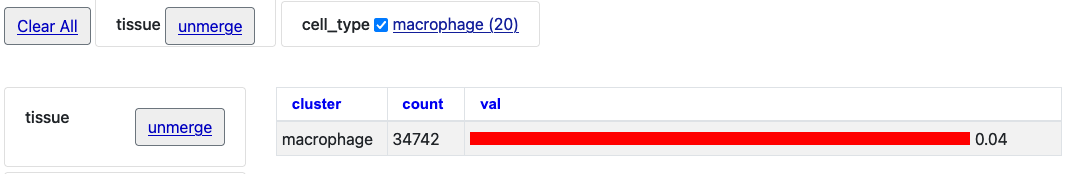
Click the "unmerge" button next to "tissue" and the single bar chart will expand with tissue clusters.
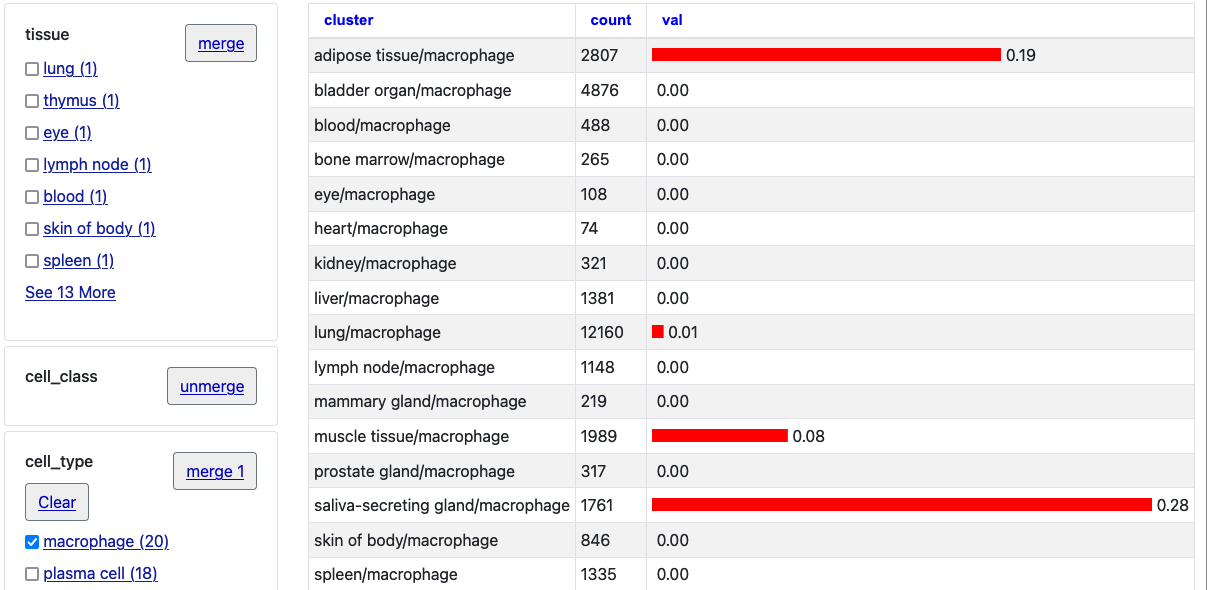
In these ways the new barChartFacets, barChartStatsUrl, and barChartMerge settings allow users to explore the barChart data on the individual details page more closely. You can use the facets to further select certain types and also click the columns (val/count/cluster) to arrange by numerical value or alphabetical name.
Also, if you click the "Return to Genome Browser" link, you will see only these selections bars are displayed.
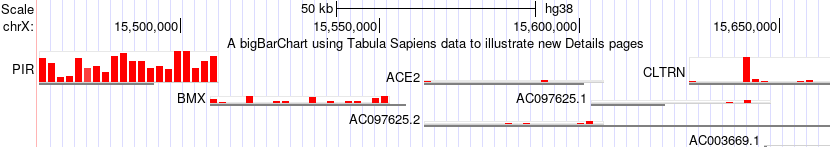
In this image after making the selections browsing ACE2 the "zoom out" button has been clicked to also view nearby genes where the expression of these tissue selections for the gene PIR is quite noticeably different.
BIGPSL TRACKS
The Pairwise Alignments bigPsl format, http://genome.ucsc.edu/goldenPath/help/bigPsl.html, had additional settings documented:
This setting specifies some display configuration options for psl tracks.
This setting shows CDS for PSL tracks at all zoom levels.
This setting helps to specify the maximum zoom-out allowed for displaying the CDS for psl tracks.
These additional bigPsl settings were in response to the many new tracks in support of the T2T CHM13 assembly hub browser: http://genome.ucsc.edu/goldenPath/newsarch.html#041222
BIGBED TRACKS
The bigBed format, http://genome.ucsc.edu/goldenPath/help/bigBed.html, had a setting for url connections expanded.
- $<fieldName> - For bigBed based tracks only (so excluding vcf, vcfPhasedTrio, bam/cram and hic), substitute the <fieldName> value from the bigBed for this item. Note the preceding '$' before the brackets.
Example:
The enhanced url $<field2> reference can allow hub developers to more easily link back to their original resources by adding unique accession fields in their bigBed files.
Reply all
Reply to author
Forward
0 new messages