Question about conservation tracks(multiz align and phastCons)

엄다훈

Daniel Schmelter
Hello Dahun,
Thank you for emailing Genome Browser support with your questions about genome conservation scores and alignments.
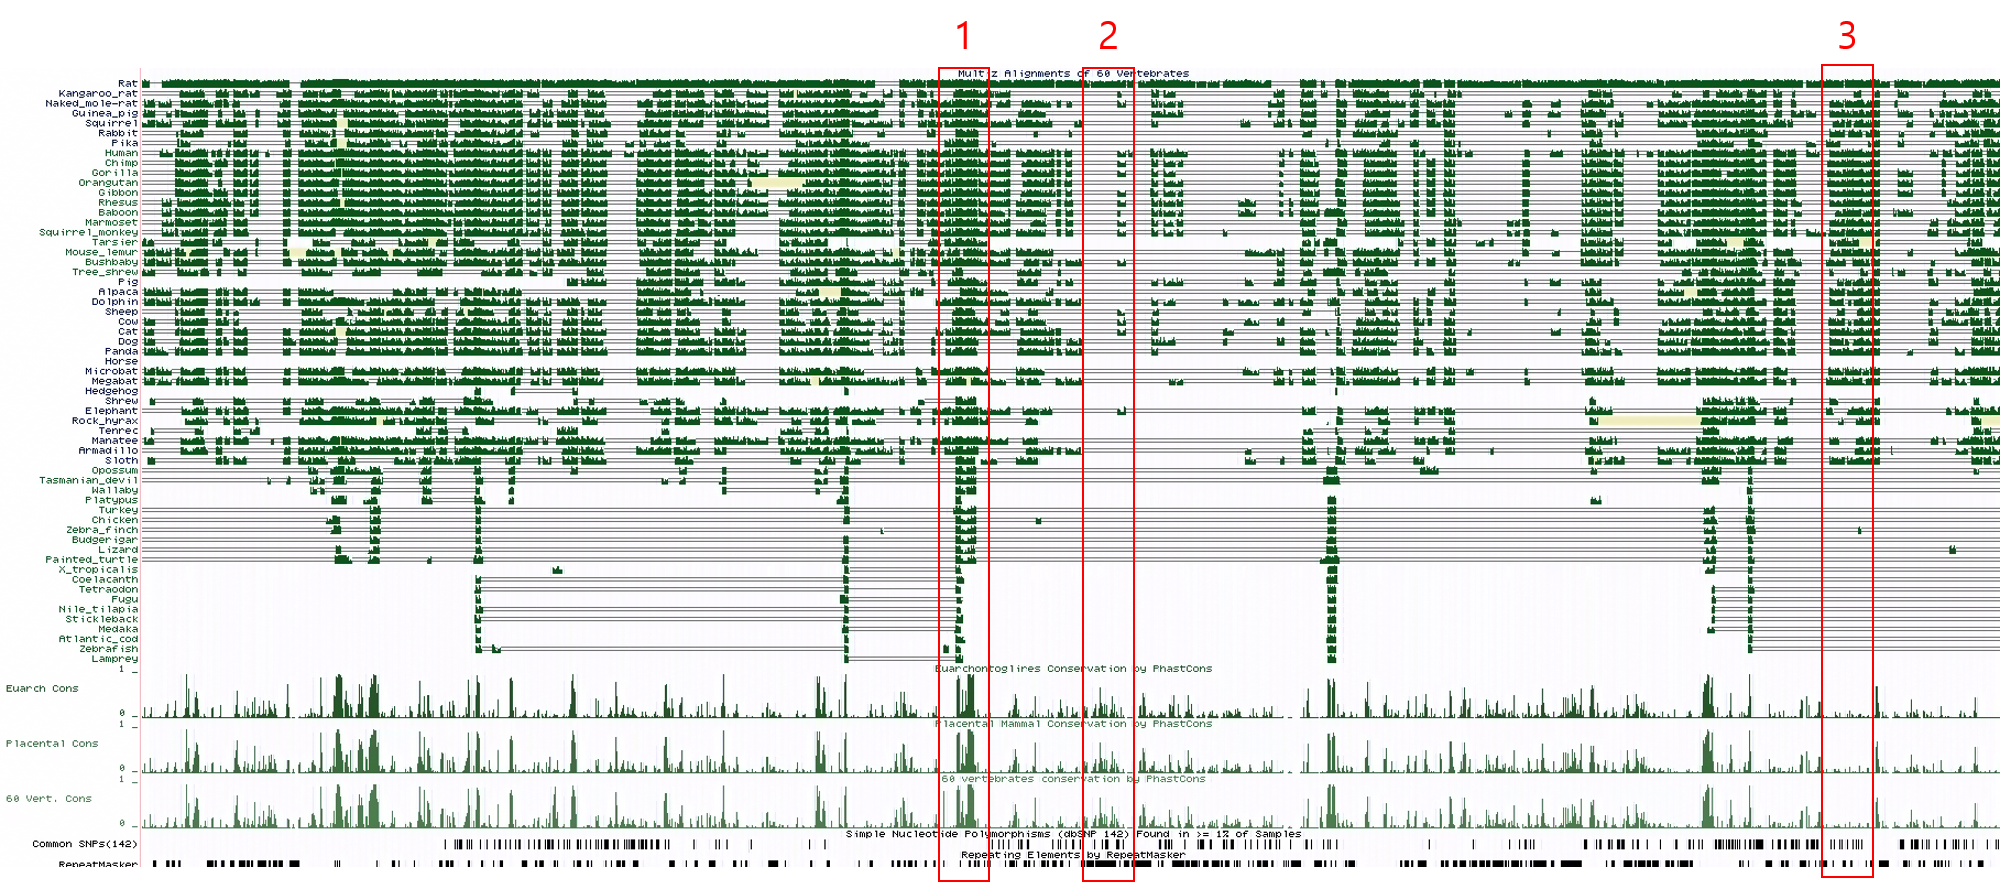
It sounds like you meant to attach a screenshot and some example regions, but they were not included in your previous email. The MultiZ output and PhastCons are intentionally different, with separate goals for their analysis. The PhastCons data is meant to identify Conserved Elements, based on individual and adjacent bases, compared with the set of 60 genomes. You may be interested in reading the track description here:
https://genome.ucsc.edu/cgi-bin/hgTrackUi?db=mm10&g=cons60way
PhastCons is written and intended for multiple alignments. If you want to see pairwise alignments, you can use the MultiZ organism filters to select only your desired organism. Scores exist for these alignments across the genome and can be exported or downloaded. It may help us to understand what you want to do with these pairwise alignment scores.
I hope this was helpful. If you have any more questions, please reply-all to gen...@soe.ucsc.edu. All messages sent to that address are publicly archived. If your question includes sensitive data, please reply-all to genom...@soe.ucsc.edu.
All the best,
Daniel Schmelter
UCSC Genome Browser
--
---
You received this message because you are subscribed to the Google Groups "UCSC Genome Browser Public Support" group.
To unsubscribe from this group and stop receiving emails from it, send an email to genome+un...@soe.ucsc.edu.
To view this discussion on the web visit https://groups.google.com/a/soe.ucsc.edu/d/msgid/genome/CABbK9tqtkvC-nEByUQpVkYNjnOFS04Z-FQAxE2j1C61A3zFS8Q%40mail.gmail.com.
엄다훈

Brian Lee
Dear Dahun,
Thank you for using the UCSC Genome Browser and your question about MultiZ and phastCons data.
The phastCons data is not scored in a linear combination of the alignments that are displayed in the separate MultiZ tracks. The phastCons methods involve statistical Hidden Markov Model (HMM) processes where some parameters from training processes result in the final scores to predict likelihood of conservation. The methods can impart more weight when there is a match with more distantly related species, where the thinking is that one would expect a lot more divergence from those distant genomes. Reviewing some of the references will provide a more detailed explanation, such as "Phylogenetic Hidden Markov Models" available here: https://link.springer.com/chapter/10.1007/0-387-27733-1_12 or this help page for the program: http://compgen.cshl.edu/phast/help-pages/phastCons.txt
For accessing the phastCons data, it may help to understand that even when you show less species in the multiple alignment MulitZ track, that doesn't change the phastCons scores displayed. There are the three mm10 tracks, Euarchontoglires Conservation, Placental Mammal Conservation, and 60 vertebrates conservation by PhastCon. Any further subset calculations would have to be recalculated with the program independently. This is to say, if you wanted the PhastCons for just a section of fish species, it would require independent work to discover those values.
As Daniel shared, the track description page, https://genome.ucsc.edu/cgi-bin/hgTrackUi?db=mm10&g=cons60way, provides many details that can be helpful to review. For accessing the data, while you can use the Table Browser, it is imperfect and not recommended when looking at wider regions. On the Track Description page there is a "Downloads for data in this track are available" section just below the settings options, where you can click a link for "PhastCons conservation (WIG format)" and arrive at our downloads page, where you can extract data directly: http://hgdownload.soe.ucsc.edu/goldenPath/mm10/phastCons60way/
There are programmatic command-line ways to extract data from these files. If it might be helpful, there is a way to use a tool bigWigToWig to extract coordinate regions on these files such as the following to extract just a region of data from the 60way file:
That data output can even be loaded back as a custom track by adding a line like "track name=bigWigOutput type=wig" to the top of the file. You can get the bigWigToWig utility here: http://hgdownload.soe.ucsc.edu/admin/exe/
Lastly, if it might help explain the unique properties of the MultiZ view. On the Track Description page under the "Display Conventions and Configuration" section there is a note how the "full" display (like the the one shared in your screenshot) is an indication of alignment quality. I think that might help reflect a bit more that the wiggle display shared does not equate to a score, but is rather an attempt by the Browser software to represent the base DNA information at a wider zoom level of the individual base information visible upon zooming in close enough.
Thank you again for your inquiry and for using the UCSC Genome Browser. If you have any further public questions, please send new questions to gen...@soe.ucsc.edu. All messages sent to that address are archived on a publicly accessible forum to help others find answers to similar questions. If your question includes sensitive data, you may send it instead to genom...@soe.ucsc.edu, which is a private internal list to our support team.
All the best,
To view this discussion on the web visit https://groups.google.com/a/soe.ucsc.edu/d/msgid/genome/CABbK9trJxft8UxH%3D36bYXBYTQ8zQrHZ%2BbqtLTTrObhtjqjdkGw%40mail.gmail.com.