New Track Hub bigBarChart display and selection features
5 views
Skip to first unread message

Brian Lee
May 2, 2022, 2:38:12 PM5/2/22
to UCSC Genome Browser project announcements
We are pleased to announce new settings to support the display and selection of bigBarChart data in Track Hubs, described here: http://genome.ucsc.edu/goldenPath/newsarch.html#050222
The bigBarChart
track format displays a bar graph of category-specific values over genomic regions and is
useful for displaying gene expression across a spectrum of tissues or other datasets where
it is desirable to compare a set of related variables over specific genomic regions.
Two new settings barChartBarMinWidth
and barChartBarMinPadding
allow customizing the width and padding between bars, as can be seen in these two example
tracks below using these settings on the same source data. More specific details on these new settings are on the bigBarChart help page.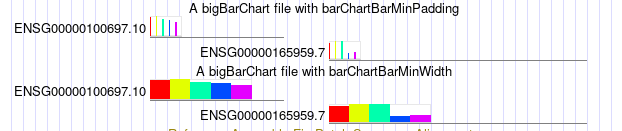
Another set of new bigBarChart track
settings aid in the selection of bar charts via the details page:
barChartFacets,
barChartStatsUrl,
and barChartMerge.
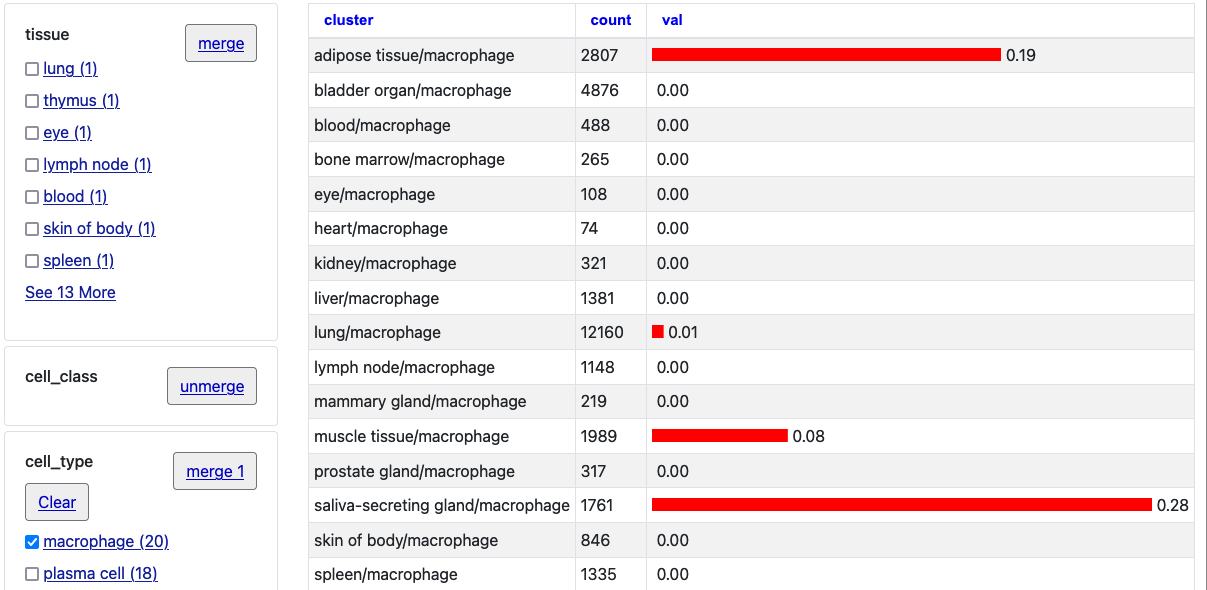
See an example illustrating these new selection settings on the bigBarChart help page. The new settings can help Track Hub Developers using bigBarCharts to allow users to dynamically interact with the bars in their Track Hubs.
Reply all
Reply to author
Forward
0 new messages