Visualize gene pathways and interactions!
8 views
Skip to first unread message

Matthew Speir
Jun 22, 2017, 7:03:12 PM6/22/17
to genome-...@soe.ucsc.edu
Individual genes do not exist in a vacuum and their expression,
activation, and function are often dependent on their interactions
with other genes, frequently as part of pathways or complexes. The
new "Gene Interactions" tool combines data from a number of curated
interaction and pathway databases as well as interactions
mined from over 20 million PubMed abstracts through the Literome
project.
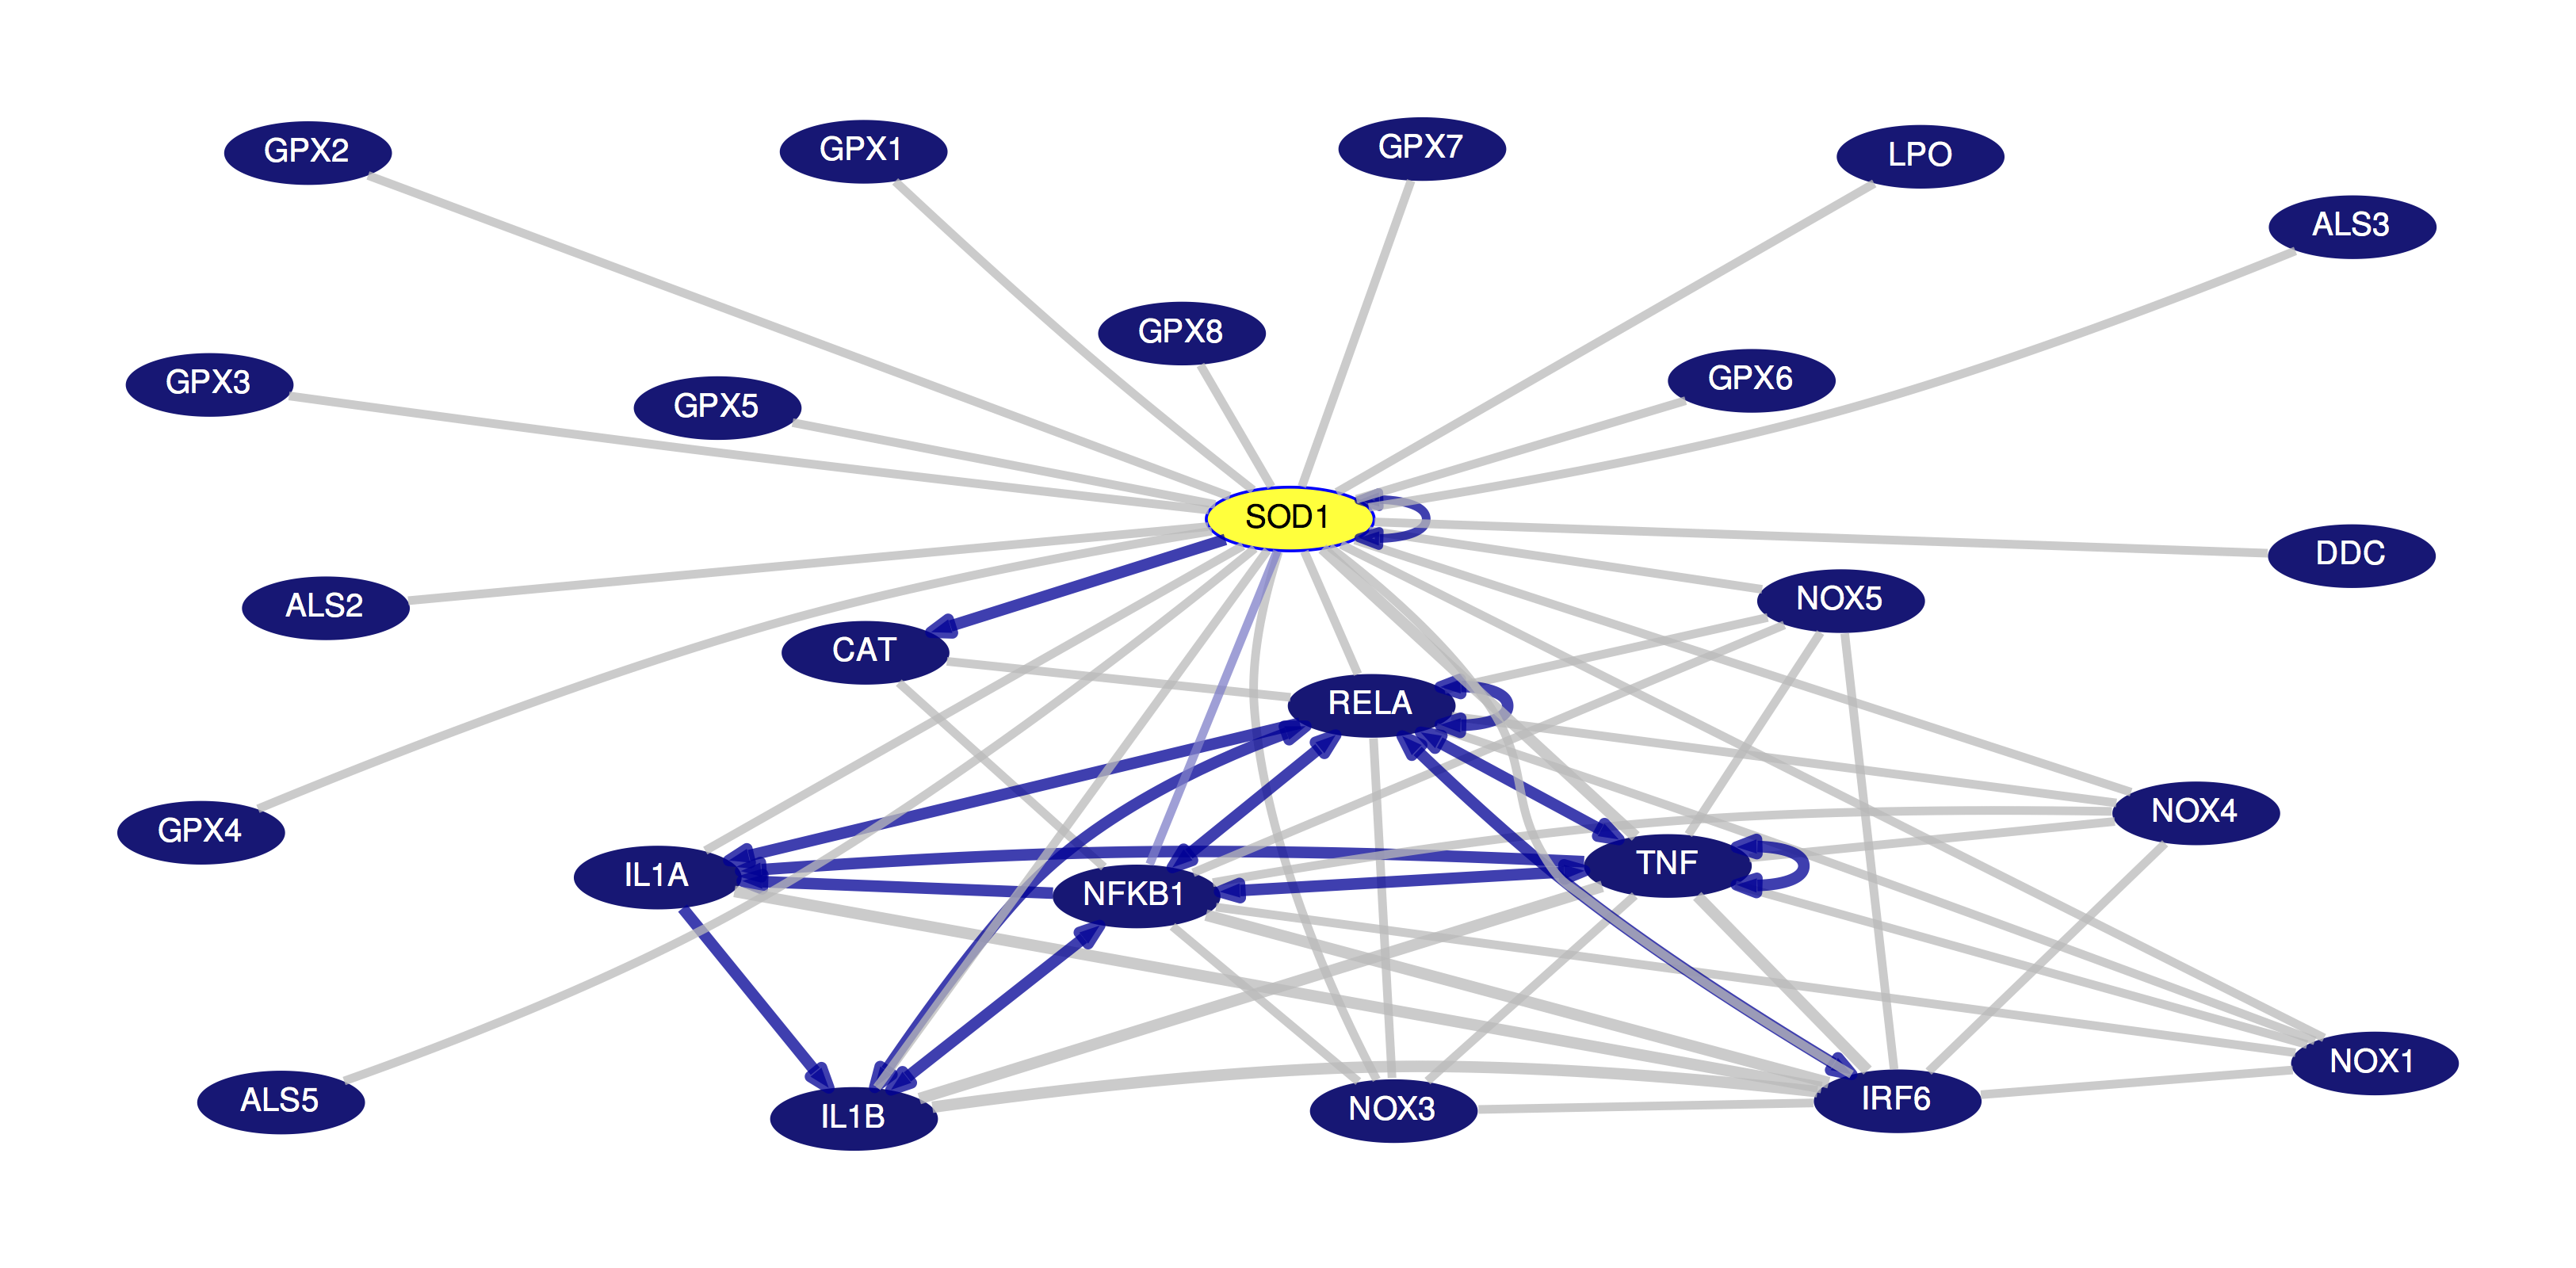
This new tool displays a detailed pathway and interaction graph for a selected gene, marked in yellow. This primary gene is connected by lines to other genes, with those displayed representing the interactions with the most support from both text mining and databases. You can hover over any gene in the image to see more details about its product; you can hover over the connecting lines to see more detailed information about the data supporting a particular interaction. Clicking on one of these interaction lines brings you to a page that provides links to supporting information. Interactions can be filtered based on various support levels (both text-mined and databases, all databases, curated-only databases); and genes can be annotated and colored according to a variety of properties (GNF2 average expression, DrugBank and more.) You can read more about this tool and its features on the help page.
This new interaction graph can be accessed from the "Tools" menu or through the "Gene Interactions" track for the human assemblies hg38 or hg19. Note that while this tool can be accessed from the "Tools" menu while browsing any genome assembly, the data will always be based on human sources.
A huge thank you to the many collaborators and contributors who helped by providing their databases and expertise. Thank you to Max Haeussler and Matthew Speir at the UCSC Genome Browser for all of their efforts in the creation and release of these new resources.
---
Matthew Speir
UCSC Genome Bioinformatics Group
Reply all
Reply to author
Forward
0 new messages