System monitors
kthat...@googlemail.com
Hi Guys
Not sure if any of you geniuses can help a 78 year old understand this problem.
I have a 3.68KW Solaredge system fitted in October 2015,.
I am monitoring output, usage and costs in three different ways.
I. The generation meter. (for FIT Payments).
2. The solaredge portal. (for average daily, monthly, and yearly generation)
3. An actual monitoring system (Geo solo 3) made by Green energy options of Cambridge. The Solo III PV. Is an easy-to-read solar display that shows kW generated, ££s earned through the Feed in Tariff (FIT) and CO2 saved – viewable both in real-time and as historic data, the Solo III PV will even tell me when to turn on my high-load home appliances to help you use every last kW drop of generated energy.
My intention to use the Solo system was to give me an idea on savings made by the PV system, which, when added to the FIT payments would give me an idea as to the return of my investment into the original cost of fitting the PV system.
Having used these systems for about a year now I find all three systems are telling different reading.
The Generation meter readings are, I assume is accurate but the Solaredge portal readings are about 3.8% higher than the generation meter, while the Solo system readings are about 18% lower.
The inverter, generation, and Solo 3 meters are all about 3 feet apart.
Can anyone explain the big differences please?
Thank you.
Keith.
Ian Bocking
From a 73 year old junior. I also have a Solar Edge installation which includes a GEM hot water heater diverter. Rather than try to reconcile all the different inputs and outputs I use the Generation meter as the primary information source since, in my view, that is where the system interfaces with the rest of the world, indicates the FIT payments and provides a consistent view of the operation.
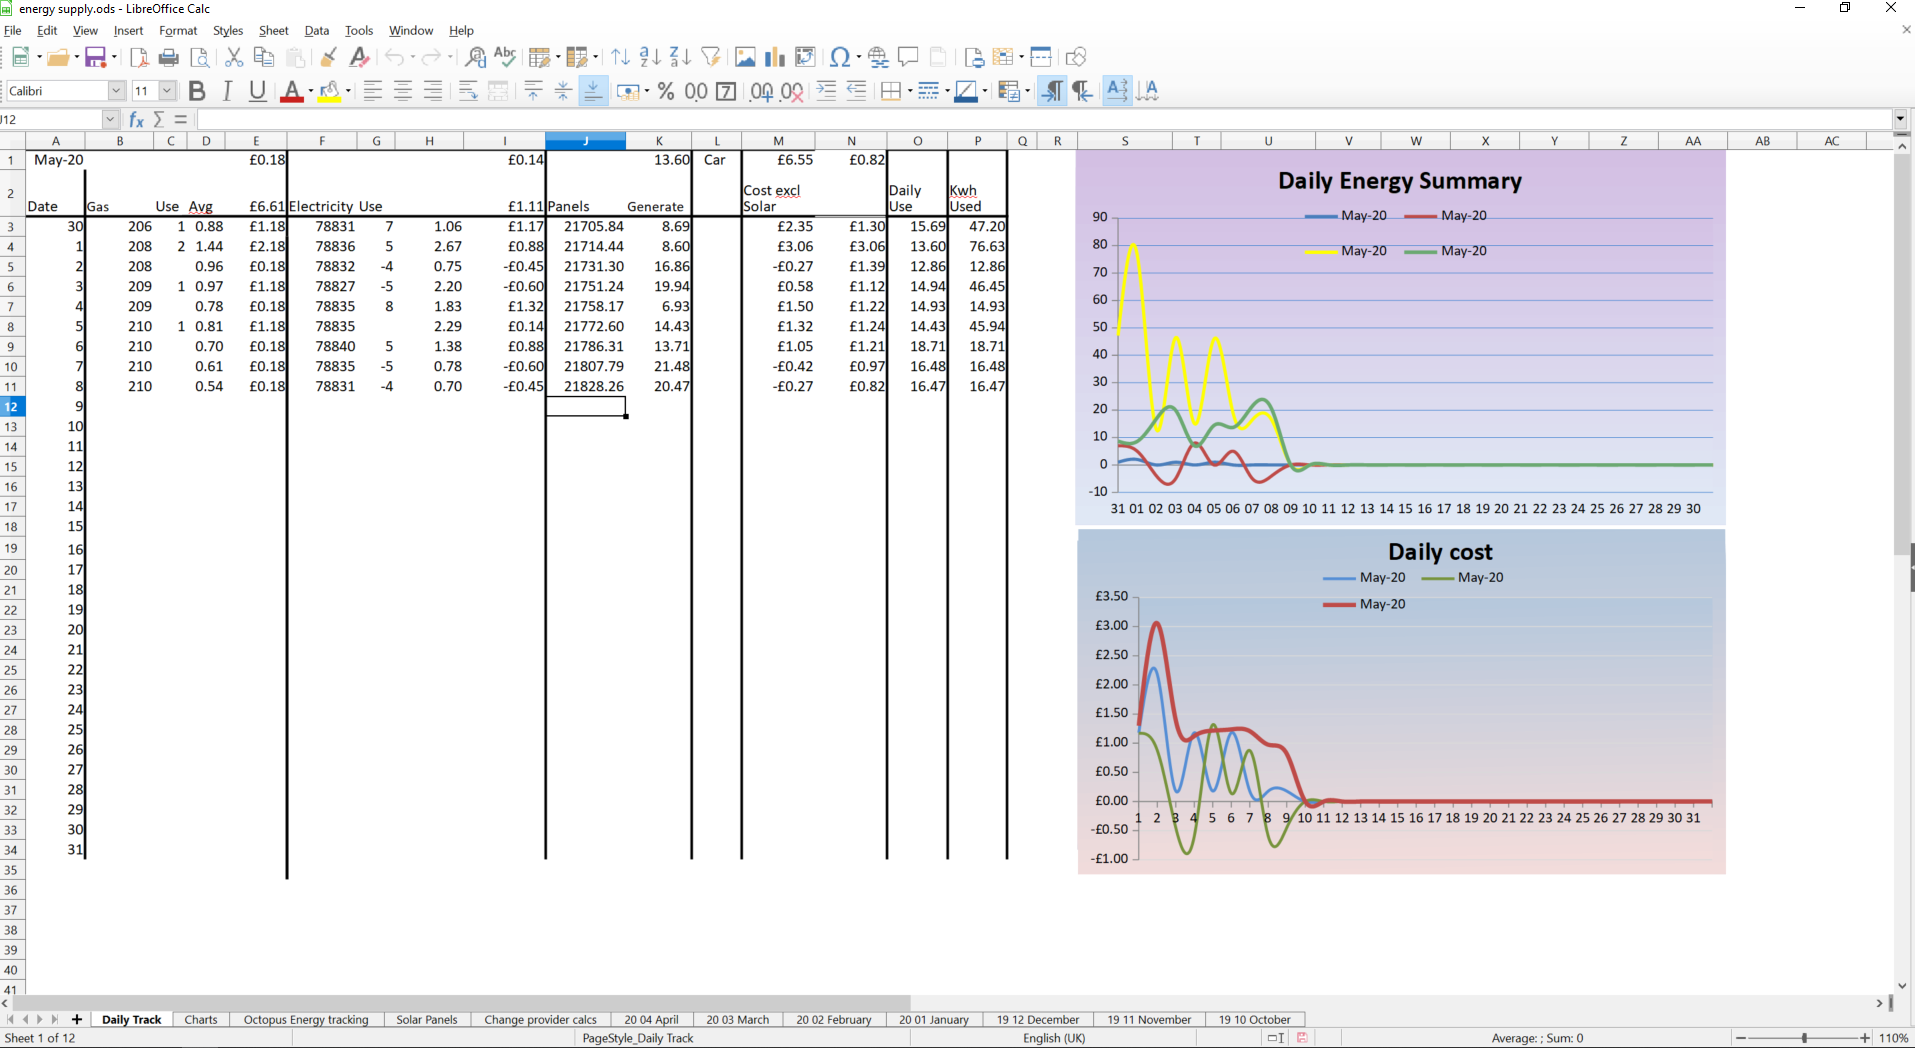
I have a spreadsheet on which I record daily utility consumption, mains electricity, PV generation and Gas. In general terms the graphs produced provide an overall view of the system performance and, when I plug the car in, the spreadsheet flags up the additional load over normal household consumption.
I use the Solar Edge portal to give rough comparisons year on year that will inform me if there are any issues with the installation.
Kind Regards,
Ian Bocking
ianbo...@gmail.com
--
You received this message because you are subscribed to the Google Groups "Microgen Database" group.
To unsubscribe from this group and stop receiving emails from it, send an email to microgen-database...@sheffield.ac.uk.
To view this discussion on the web, visit https://groups.google.com/a/sheffield.ac.uk/d/msgid/microgen-database-group/107c4dff-26cf-4ec0-bab6-6e22f3a31572%40sheffield.ac.uk.
El Bocko
Ian Bocking
Hi IanThank you for your interesting response.I have an Iboost system just to heat the hot water tank, but apart from the readings on the generation meter, (which just tell what I generate per day) how do you record your daily utility consumption, mains electricity, PV generation etc.Regards.Keith.
Ian Bocking
John Rush
https://www.pvoutput.org/statistic.jsp?id=75790&sid=67190
You can upload the daily figures easily enough and the summary makes interesting reading.
El Bocko
From a 73 year old junior. I also have a Solar Edge installation which includes a GEM hot water heater diverter. Rather than try to reconcile all the different inputs and outputs I use the Generation meter as the primary information source since, in my view, that is where the system interfaces with the rest of the world, indicates the FIT payments and provides a consistent view of the operation.
I have a spreadsheet on which I record daily utility consumption, mains electricity, PV generation and Gas. In general terms the graphs produced provide an overall view of the system performance and, when I plug the car in, the spreadsheet flags up the additional load over normal household consumption.
I use the Solar Edge portal to give rough comparisons year on year that will inform me if there are any issues with the installation.
--Not sure if any of you geniuses can help a 78 year old understand this problem.
I have a 3.68KW Solaredge system fitted in October 2015,.
I am monitoring output, usage and costs in three different ways.
I. The generation meter. (for FIT Payments).
2. The solaredge portal. (for average daily, monthly, and yearly generation)
3. An actual monitoring system (Geo solo 3) made by Green energy options of Cambridge. The Solo III PV. Is an easy-to-read solar display that shows kW generated, ££s earned through the Feed in Tariff (FIT) and CO2 saved – viewable both in real-time and as historic data, the Solo III PV will even tell me when to turn on my high-load home appliances to help you use every last kW drop of generated energy.
My intention to use the Solo system was to give me an idea on savings made by the PV system, which, when added to the FIT payments would give me an idea as to the return of my investment into the original cost of fitting the PV system.
Having used these systems for about a year now I find all three systems are telling different reading.
The Generation meter readings are, I assume is accurate but the Solaredge portal readings are about 3.8% higher than the generation meter, while the Solo system readings are about 18% lower.
The inverter, generation, and Solo 3 meters are all about 3 feet apart.
Can anyone explain the big differences please?
Thank you.
Keith.
You received this message because you are subscribed to the Google Groups "Microgen Database" group.
To unsubscribe from this group and stop receiving emails from it, send an email to microgen-database-group+unsub...@sheffield.ac.uk.
kthat...@googlemail.com
To unsubscribe from this group and stop receiving emails from it, send an email to microgen-database-group+unsub...@sheffield.ac.uk.
To view this discussion on the web, visit https://groups.google.com/a/sheffield.ac.uk/d/msgid/microgen-database-group/107c4dff-26cf-4ec0-bab6-6e22f3a31572%40sheffield.ac.uk.
Kind Regards,
Ian Bocking

