Large connection spike after upgrading 2.0.6 -> 2.0.8
63 views
Skip to first unread message

Mike Heffner
Dec 4, 2014, 11:46:41 AM12/4/14
to java-dri...@lists.datastax.com
Hi,
We just tried rolling out an upgrade where we updated from the 2.0.6 driver to the 2.0.8 version. The version bump was the only thing that changed in this upgrade. We are connecting to C* 2.0.9 using HSHA.
Immediately after pushing out the new version we noticed the Thrift open connections to the C* rings began climbing (see attachment).
Prior to this we were seeing a maximum of about 75 connections to a single ring. Before we were able to roll this back the connection count shot up to 250 and was still climbing.
We plan to continue debugging this, but is there an issue between 2.0.6 and 2.0.8 that would have led to this? Has anyone else noticed this?
Mike
Mike Heffner
Dec 4, 2014, 11:47:18 AM12/4/14
to java-dri...@lists.datastax.com
s/Thrift/CQL/
Andrew Tolbert
Dec 4, 2014, 5:27:18 PM12/4/14
to java-dri...@lists.datastax.com
Hi Mike,
On Thursday, December 4, 2014 10:46:41 AM UTC-6, Mike Heffner wrote:
Immediately after pushing out the new version we noticed the Thrift open connections to the C* rings began climbing (see attachment).Prior to this we were seeing a maximum of about 75 connections to a single ring. Before we were able to roll this back the connection count shot up to 250 and was still climbing.
That is interesting, I would not expect this. The maximum number of connections for a given Cluster instance to each host should be restricted to PoolingOptions#maxConnectionsPerHost. The default will be 8 per host if the host is local distance, 2 if remote. The LoadBalancingPolicy chosen will dictate the distance of the host (i.e. if using DC Aware policy it will consider hosts on a separate DC from the local datacenter. For example, if you have 1 Cluster instance, with 9 nodes in your ring in a local DC, you should top out at 73 (9*8 + 1 (control connection)) connections. If you know how many instances of your application you have running against your cassandra ring, how many cluster instances are defined within the application, and how your pooling options are configured, that will help understand how many potential maximum connections you can have to your ring.
However, as you mentioned, you only tweaked the driver version dependency with this change, so I suspect that for whatever reason there are more active requests in flight on your connections. Connections will grow for a host if the least busy connection for that host pool exceeds PoolingOptions#maxSimultaneousRequestsPerConnectionThreshold. The number of 'inflight' requests per connection is incremented whenever a connection is borrowed to send a request, and decremented whenever the connection is released (this happens when a request completes, whether that be a successful response, failure, cancellation, etc.). I suppose it is possible that for whatever reason that whenever a request completes and the number of inflight connections is not decremented on that connection that it would cause the driver to think a connection is more busy than it really is, causing it to create more connections to that host. I'll see if I can produce any such scenario.
Do you suspect that the number of connections would continue growing over time? I would think that maxConnectionsPerHost would eventually be hit on each client (if it really needed that many connections), stabilizing the number of connections instead of growing indefinitely. If you can calculate your theoretical max connections based on number of applications running, clusters per application, and pooling settings and determine that the maximum is being exceeded that could indicate there is something very wrong somewhere.
Andy
Mike Heffner
Dec 4, 2014, 5:37:32 PM12/4/14
to java-dri...@lists.datastax.com
Andrew,
Thanks for following up.
I did run this a bit longer on only one specific node in our app tier and I found that it did grow to the maxConnectionsPerHost level: 8 connections per host, a total of 264 connections for our 33 node ring (actual value was 265, but I figure there's a buffer of one somewhere).
I haven't changed any other other pooling options with this deploy. Is it possible the idle connection handling is causing the connection count to grow instead of getting reclaimed?
How can I monitor the total number of requests? Will the request timer give me that? http://www.datastax.com/drivers/java/2.0/com/datastax/driver/core/Metrics.html#getRequestsTimer()
Mike
To unsubscribe from this group and stop receiving emails from it, send an email to java-driver-us...@lists.datastax.com.
Andrew Tolbert
Dec 4, 2014, 5:52:44 PM12/4/14
to java-dri...@lists.datastax.com
Hi Mike,
I did run this a bit longer on only one specific node in our app tier and I found that it did grow to the maxConnectionsPerHost level: 8 connections per host, a total of 264 connections for our 33 node ring (actual value was 265, but I figure there's a buffer of one somewhere).
Excellent, thanks for confirming that, it is good to confirm that the maximumConnectionsPerHost config is being respected as expected. The buffer of 1 comes from the control connection.
I haven't changed any other other pooling options with this deploy. Is it possible the idle connection handling is causing the connection count to grow instead of getting reclaimed?
Possibly, but my thoughts are if you have running into errors and the driver is reacting in a poor way (not decrementing number of inflight connections) that it could make the connections appear busier than they actually are, causing more to be created. I don't expect this to be happening (I'm running a stress scenario against 2.0.8 right now and am not observing that at the moment). I'm assuming you and Jared Kuolt are working together on this and he mentioned in his post that you are encountering timeouts caused by a spike in traffic.
How can I monitor the total number of requests? Will the request timer give me that? http://www.datastax.com/drivers/java/2.0/com/datastax/driver/core/Metrics.html#getRequestsTimer()
Good catch, the requestTimer is a great resource for this. A new request context gets created for each request handler, and it is completed whenever the request is completed or failed. That will show you both the response latency percentiles and the rate of requests. If you have a mechanism to compare this before and after, that would be really interesting to see. If the metrics are similar between 2.0.6 and 2.0.8 for both latencies and rate, that would indicate to me that something is going askew in the driver, but if they are different, that could indicate some change in behavior, whether it be better application, driver or cassandra ring performance (can push more requests through).
Andy
Mike Heffner
Dec 4, 2014, 7:29:54 PM12/4/14
to java-dri...@lists.datastax.com
Andrew,
I haven't changed any other other pooling options with this deploy. Is it possible the idle connection handling is causing the connection count to grow instead of getting reclaimed?Possibly, but my thoughts are if you have running into errors and the driver is reacting in a poor way (not decrementing number of inflight connections) that it could make the connections appear busier than they actually are, causing more to be created. I don't expect this to be happening (I'm running a stress scenario against 2.0.8 right now and am not observing that at the moment). I'm assuming you and Jared Kuolt are working together on this and he mentioned in his post that you are encountering timeouts caused by a spike in traffic.
Yes, we are working together on this project. Jared did the analysis of the deadlock that we hit after a spike in traffic/timeouts. The timeouts are relatively rare, so it didn't seem to be correlated with the connection increase.
How can I monitor the total number of requests? Will the request timer give me that? http://www.datastax.com/drivers/java/2.0/com/datastax/driver/core/Metrics.html#getRequestsTimer()Good catch, the requestTimer is a great resource for this. A new request context gets created for each request handler, and it is completed whenever the request is completed or failed. That will show you both the response latency percentiles and the rate of requests. If you have a mechanism to compare this before and after, that would be really interesting to see. If the metrics are similar between 2.0.6 and 2.0.8 for both latencies and rate, that would indicate to me that something is going askew in the driver, but if they are different, that could indicate some change in behavior, whether it be better application, driver or cassandra ring performance (can push more requests through).
I reverted the driver bump and pushed out a version just tracking this metric. I'll let that run overnight and then try a deploy of the new version again to compare the request latency/rate before and after.
Cheers,
Mike
Mike Heffner
Dec 5, 2014, 10:34:24 AM12/5/14
to java-dri...@lists.datastax.com
Andrew,
I reverted the driver bump and pushed out a version just tracking this metric. I'll let that run overnight and then try a deploy of the new version again to compare the request latency/rate before and after.
I tracked the request time p95 and count metrics overnight and deployed the update 2.0.6->2.0.8 this morning. The following graph shows p95 latency and request counts and the second shows the increase in open connections. The deploy time is marked on both with an annotation:
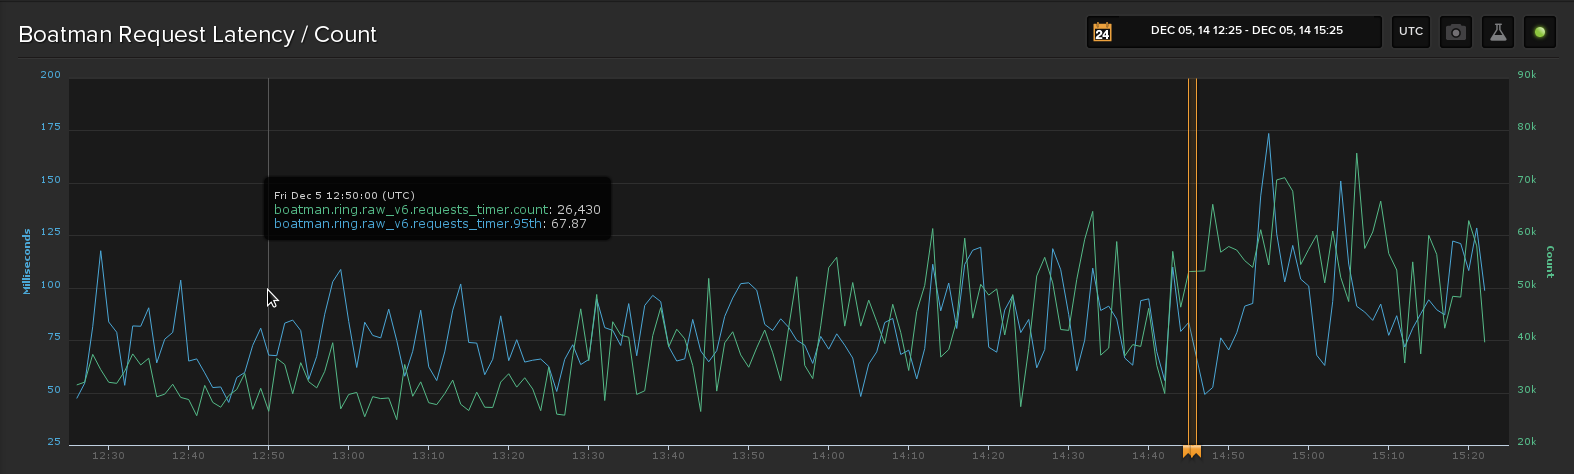
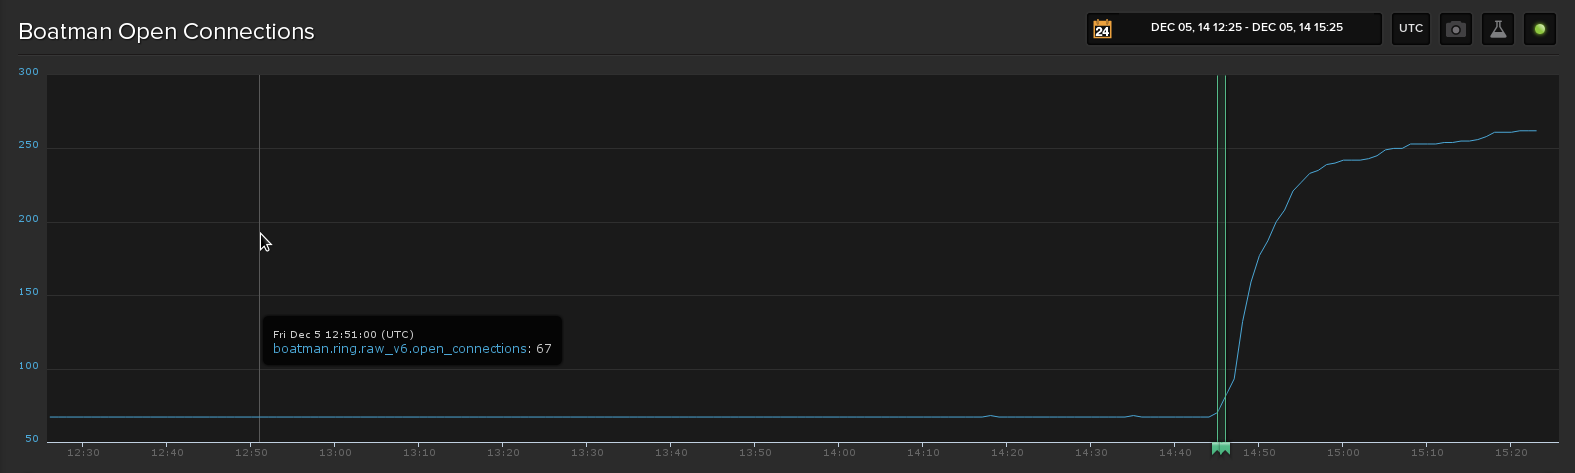
The request count is a bit noiser after the deploy, but it doesn't seem to have the same exponential like increase seen in the open connections.
For context, we use the following load balancing policy:
withLoadBalancingPolicy(
LatencyAwarePolicy.builder(new DCAwareRoundRobinPolicy())
with a retry policy of:
withRetryPolicy(new LoggingRetryPolicy(FallthroughRetryPolicy.INSTANCE))
and we set the read timeout socket option to 6 seconds. Anything else is set to the defaults
Hope that helps, let me know if you need any other info.
-Mike

Olivier Michallat
Dec 5, 2014, 12:53:09 PM12/5/14
to java-dri...@lists.datastax.com
Hi Mike,
The figures clearly show the connection pools switching from core size (33 * 2 + 1) to max size (33 * 8 + 1) after the upgrade, for a roughly equivalent request count. As Andrew noted, this could be an issue with the pending request count not being correctly updated on connections. This has happened in the past, but we have no known issues for 2.0.7 or 2.0.8 (and I don't think it could be related to idle connection handling).
I'm running tests to try to reproduce this behavior locally.
--
Olivier Michallat
Driver & tools engineer, DataStax
Olivier Michallat
Dec 8, 2014, 4:45:11 AM12/8/14
to java-dri...@lists.datastax.com
Hi Mike,
I have not yet reproduced the behavior you observe with 2.0.8.
It would be interesting to monitor the number of "in flight" queries reported by the driver. Due to its dynamic structure, this information is not directly exposed as a metric, but it can be retrieved via the API (see this gist). Could you try to run it from your app?
--
Olivier Michallat
Driver & tools engineer, DataStax
Mike Heffner
Dec 9, 2014, 12:59:04 PM12/9/14
to java-dri...@lists.datastax.com
Olivier,
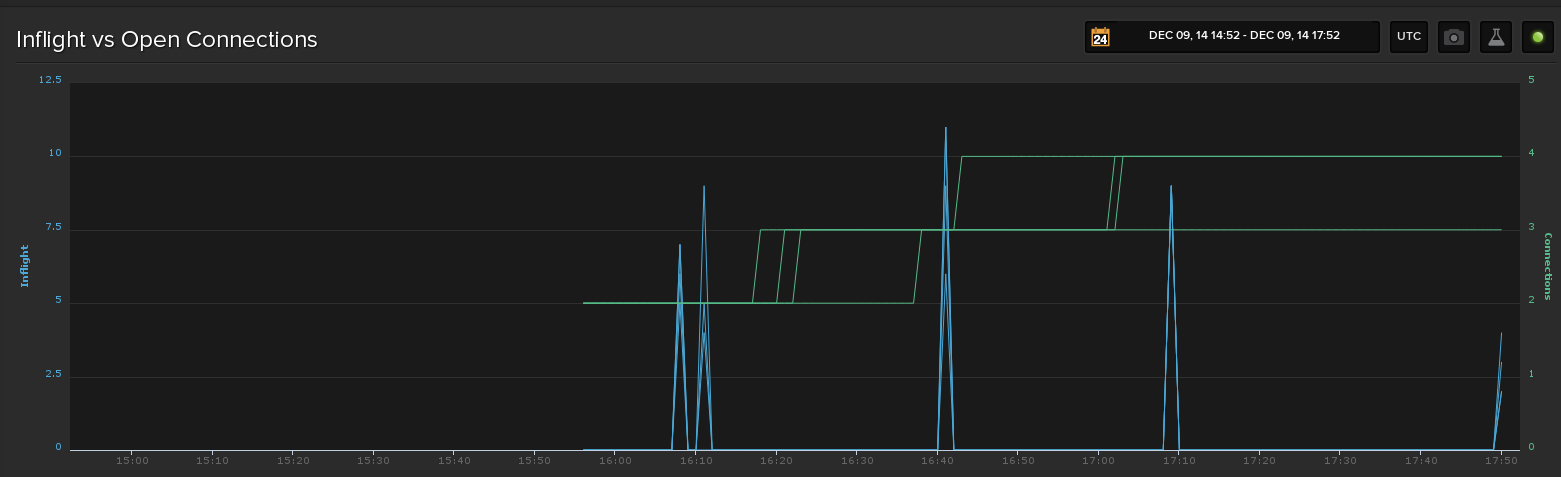
The attached image shows a plot of open connections vs in-flight requests as recorded by the gist you shared. What I could see that is that we had a few spikes where in-flight requests were recorded as > 0 for all hosts in the ring. It appears that most of the time in-flight requests return to zero, ie, there doesn't seem to be a growing accumulation or failure to decrease. As you can see the connections per host continues to rise, with 2.0.6 the number never appear to rise past the core connection count.
This test was done against our staging ring (curently 4 hosts), but it showed the same behavior as when we shipped this to production.
Mike
Olivier Michallat
Dec 10, 2014, 5:19:58 AM12/10/14
to java-dri...@lists.datastax.com
So what I'm seeing is a mostly idle client, with spikes that 2 core connections should handle easily (each connection handles up to 128 in flight requests, we preemptively start growing the pool when we reach the 100 mark).
As you mentioned, one of the few changes to the pool between 2.0.6 and 2.0.8 is the idle timeout before we remove connections, but after reviewing the code I still don't see how it could be related to this behaviour.
For the sake of exploring all possibilities:
* do you have a flaky network between client and server, or a router that could occasionally drop connections?
* could you try leaving the client completely idle (no requests at all)?
Apart from that, if you can activate DEBUG logging for the driver in your staging environment, I would be interested to see the output (you can email me directly).
--
Olivier Michallat
Driver & tools engineer, DataStax
Reply all
Reply to author
Forward
0 new messages