Issues about geopotential anomaly in Chile

74 views
Skip to first unread message

Lingchao He (River)

unread,
Apr 10, 2024, 1:01:36 PMApr 10
to HYCOM.org Forum, Meng Wei

Hi everyone, 


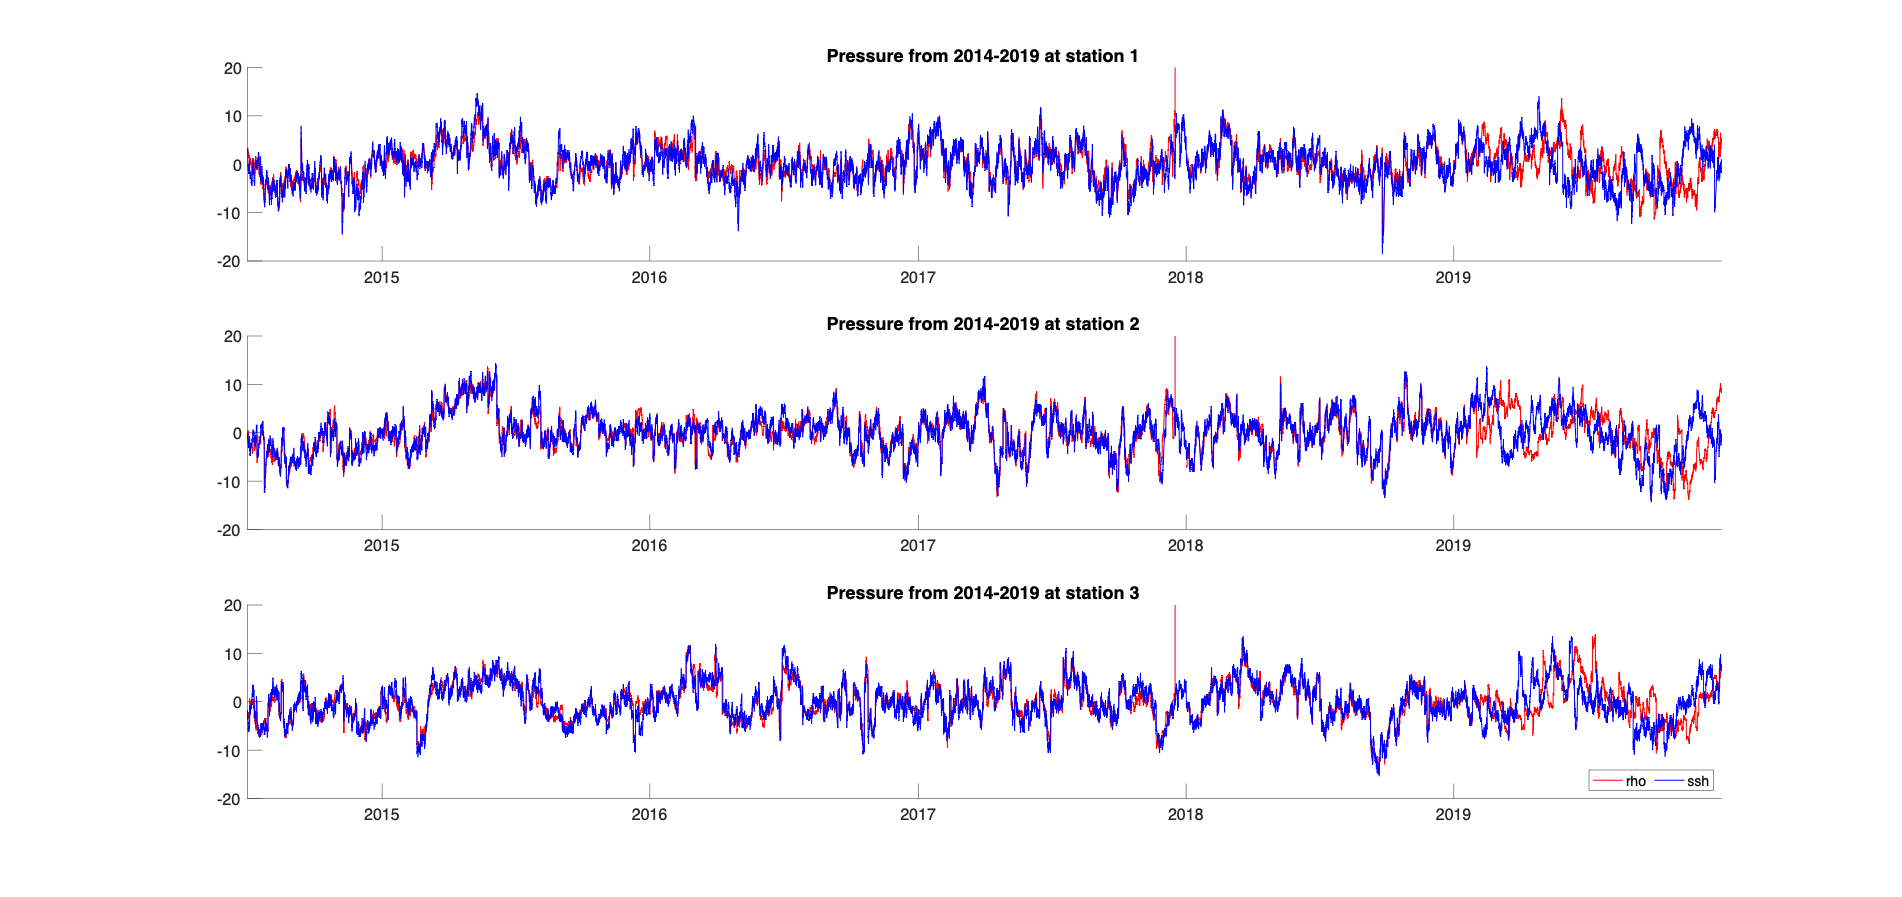
I've acquired SSH, salinity, and temperature datasets from HYCOM via https://ncss.hycom.org/thredds/ncss/GLBv0.08/expt_93.0, covering the period from July 2014 to December 2019 in Chile (-34 -28 -73.5 -71). I've processed the salinity and temperature data to compute geopotential anomaly pressure for comparison against the SSH pressure time series. The results align with expectations, except for anomalies encountered in 2017 and 2019.

Specifically, towards the end of 2017, the geopotential anomaly pressure values are significantly higher than expected. In 2019, there's a clear discrepancy between the SSH pressure data and the geopotential anomaly pressure, with the two datasets not aligning as anticipated. These discrepancies are hindering my progression to further analysis.

I have utilized the same processing approach for all data points. However, I'm uncertain whether these anomalies are attributable to issues with the HYCOM data or potential errors in my processing code or this is not a data issue. I put my result here. Hope someone can help me with this. Thanks in advance! 


Best, 
River

Rodrigo Duran

unread,
Apr 11, 2024, 3:09:46 PMApr 11
to Lingchao He (River), HYCOM.org Forum, Meng Wei
I wouldn't worry too much about the 2017 one, it seems to be a single point, and although it could be something important that warrants attention, errors at a single point in time or space are often an issue that can be ignored. 

The 2019 part of it is more worrying, could it be that HyCOM is correcting SSH from satellite altimetry and therefore the T,S version of it does not agree? Could it be that HyCOM started including atmospheric pressure in 2019? It would be good to know!

Rodrigo. 

--
--
You received this message because you are a member of HYCOM.org
To ask a question, send an email to fo...@hycom.org

To unsubscribe from this group and stop receiving emails from it, send an email to forum+un...@hycom.org.

Lingchao He

unread,
Apr 16, 2024, 6:02:35 PMApr 16
to HYCOM.org Forum, Meng Wei
Hi everyone, 

Thanks for many suggestions! I just fixed the problem I asked above. It turns out it's a data downloading issue. However, there are two high-frequency spikes (shorter than 100 days) in the bottom pressure data in March to May 2016 and Nov to Dec 2017 . A study shows there is a northward geostrophic current in the southwest of my studied area in 2016 March to May. The timing is perfect to march with my spike in 2016 but I did not find anything related to 2017 one ( except for La Niña). Could these spikes be artificial errors? Or are they related to ENSO or La Niña or any other short-term processes? And how to test the idea? Any ideas are welcome. Thank you very much!

Best,
River
image.png
image.png
image.png
image.png


--
Lingchao He(she/her)
PhD Student
University of Rhode Island
Graduate School of Oceanography
Reply all
Reply to author
Forward
0 new messages