Javascript debugging basically useless, no matter how you do it
186 views
Skip to first unread message

Guyren Howe
Oct 1, 2021, 9:50:38 PM10/1/21
to Dart Misc
I’ve been trying to develop a web app with a very simple front end with the back end in dart.
I’m giving up for now because the debugging is essentially useless.
I’m using an M1 mac with the latest MacOS and the latest versions of Dart, VS Code, Android Studio, and their plugins. I’m trying to write Dart code, execute it in the browser, and debug it (breakpoints, inspect values, etc).
I’ve tried this in the browser, and using the debugging mode of the Dart plugins in both VS Code and Android Studio, and none of it works. Breakpoints work sometimes, but usually not, I can’t usually inspect variables, there is no “evaluate expression” in any of the debuggers, I get errors all over the place.
No Flutter involved, to be clear.
It’s fine. Dart is open source. I have no reason to expect anything.
Just figured I’d post because the Dart advertising is that this works, and it just doesn’t, which is really the only thing I’m actually complaining about (although I’d sure love if it worked).
It’s a bit odd since replacing Javascript was basically Dart’s whole réson d’etre.
Guyren Howe
Oct 2, 2021, 1:19:58 AM10/2/21
to Dart Misc, Sarah King
Yeah, I should be clear.
I’m writing something to run in the browser that I could write in Javascript. I would prefer to write it in Dart. Both because I perfer Dart as a language a good deal, but more importantly because I want to share code between disparate platforms.
The code I’m writing is doing some basic Javascript DOM manipulation. I could write it pretty quickly in Javascript and the debugging tools for that in any browser are great.
With sourcemaps and VS Code and Android Studio plugins and the general marketing vibe, I expected to get something sort-of like the Javascript debugging experience.
But in fact, none of the debugging experiences in the browser were worth anything at all.
On Oct 1, 2021, 21:29 -0700, Sarah King <rai...@gmail.com>, wrote:
Are you debugging dart or javascript?I haven't used dart for the web but surely it's just spitting out text that happens to be HTML, CSS or javascript?Can you share an example?

Mark Nordine
Oct 2, 2021, 8:54:58 AM10/2/21
to Dart Misc, guy...@gmail.com, rai...@gmail.com
I thought there was something odd with my setup and WebStorm, apparently not.
Debugging with Dartium was *amazing*. Breakpoints always worked, you could hover over values in the IDE, drill down and see everything because *it was the Dart VM*.
After the switch to DDC it was a disaster for debugging. Breakpoints don't get hit, you can't hover over values, values don't even show when you do hit a breakpoint, but worst of all is the surrounding garbage when inspecting values. Everything is surrounded by "Symbols" that often don't make any sense. I quickly realized I'd be resigned to using print() to debug, which absolutely sucks after the Dartium experience.
To clarify, this is with WebStorm, the recommended IDE. I would love if someone could point out I have to do something to enable a better experience, or I'm doing something wrong.

Sarah King
Oct 4, 2021, 3:17:07 AM10/4/21
to Dart Misc, guy...@gmail.com
Are you debugging dart or javascript?
I haven't used dart for the web but surely it's just spitting out text that happens to be HTML, CSS or javascript?
Can you share an example?
On Saturday, October 2, 2021 at 2:50:38 PM UTC+13 guy...@gmail.com wrote:

John Ryan
Oct 4, 2021, 12:49:26 PM10/4/21
to Dart Misc, rai...@gmail.com, guy...@gmail.com
Could you file an issue? Dart supports setting breakpoints and evaluating expressions in Chrome. I use the "webdev serve" command (more about webdev here) with the "JavaScript Run / Debug" configuration in IntelliJ (Android Studio would probably work with the right plugins installed, but I'm not sure). You can also use the Chrome DevTools since Dart's tooling uses source maps.

Danny Tuppeny
Oct 13, 2021, 6:37:08 AM10/13/21
to Dart Misc, guy...@gmail.com
It should be possible to do some of this through VS Code's Dart debugger, although there are a few things that may not be very obvious:
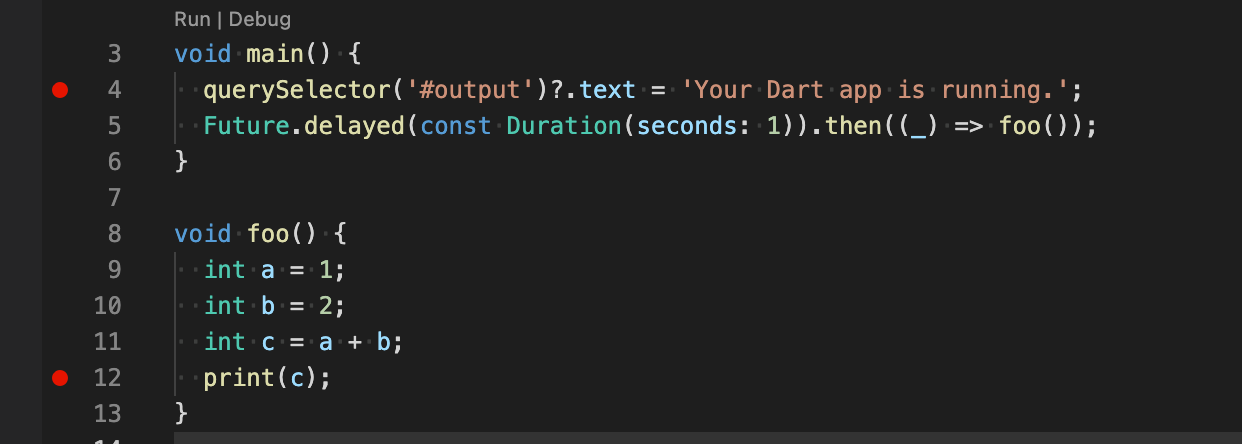
1. webdev doesn't currently support starting paused, which means that breakpoints in code that runs immediately at startup may not trigger (because the code may run before the editor has finished initialization and sending the breakpoints - there's an open issue for this here).
For example, in this code only the breakpoint on line 12 is hit:
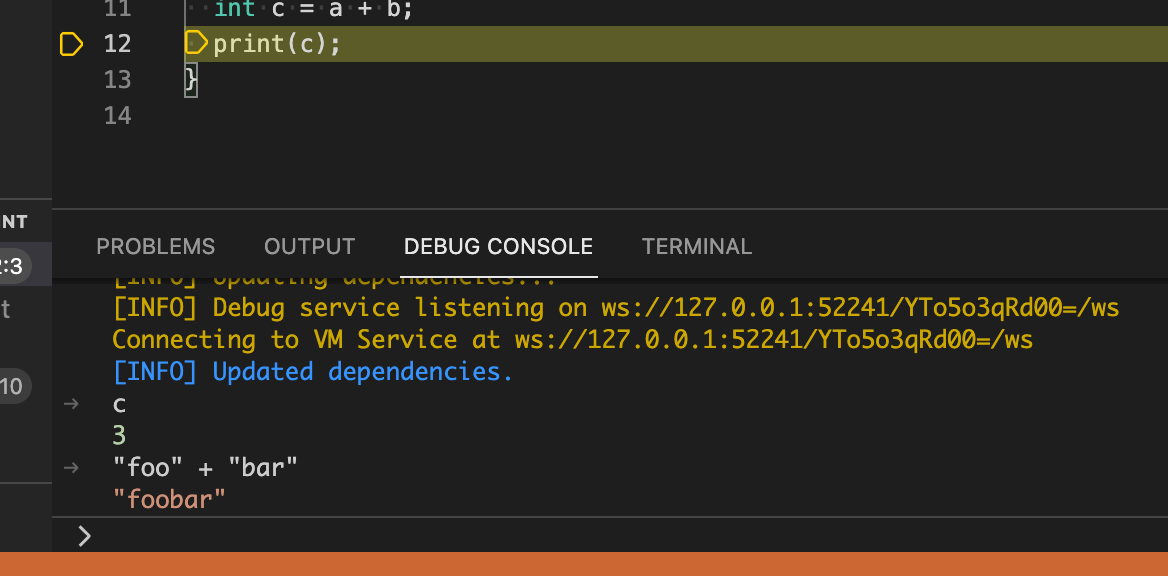
2. You need to start with --enable-expression-evaluation to enable expression evaluation in webdev (it doesn't seem to currently be enabled by default). The easiest way to do this in VS Code is to add it to args in your launch.json, so it looks like this:
{
"version": "0.2.0",
"configurations": [
{
"name": "dart_web_app",
"request": "launch",
"type": "dart",
"program": "web/index.html",
"args": [
"--enable-expression-evaluation"
]
}
]
}
With that done, I can press F5 in VS Code and have it launch in the browser and hit my breakpoint above, and I am able to evaluate expressions in the debug console:
Not everything works perfectly as there's a lot going on behind the scenes (for example expressions are typed in Dart but also need to be converted to JS for evaluation, and then the resulting JS object presented as if it was a Dart object), but it's definitely worth filing issues for anything you find that's not working (if there aren't existing issues).
Guyren Howe
Oct 13, 2021, 11:38:34 AM10/13/21
to Dart Misc, Danny Tuppeny
Many thanks.
Seems like such things should be better documented. Particularly in the intro to webdev.
Seems like such things should be better documented. Particularly in the intro to webdev.
On Oct 13, 2021, 03:37 -0700, Danny Tuppeny <da...@tuppeny.com>, wrote:
It should be possible to do some of this through VS Code's Dart debugger, although there are a few things that may not be very obvious:1. webdev doesn't currently support starting paused, which means that breakpoints in code that runs immediately at startup may not trigger (because the code may run before the editor has finished initialization and sending the breakpoints - there's an open issue for this here).For example, in this code only the breakpoint on line 12 is hit:
<Screenshot 2021-10-13 at 11.25.06.png>2. You need to start with --enable-expression-evaluation to enable expression evaluation in webdev (it doesn't seem to currently be enabled by default). The easiest way to do this in VS Code is to add it to args in your launch.json, so it looks like this:{"version": "0.2.0","configurations": [{"name": "dart_web_app","request": "launch","type": "dart","program": "web/index.html","args": ["--enable-expression-evaluation"]}]}With that done, I can press F5 in VS Code and have it launch in the browser and hit my breakpoint above, and I am able to evaluate expressions in the debug console:
Reply all
Reply to author
Forward
0 new messages