Devtools for WebTransport

Yoichi Osato
Abstract
This document proposes the Chrome DevTools support for WebTransport.
Since WebTransport supports two protocols and can create two or more streams over them, the DevTools should show them well structured.
Scenarios
We list some scenarios where web developers want to inspect WebTransport.
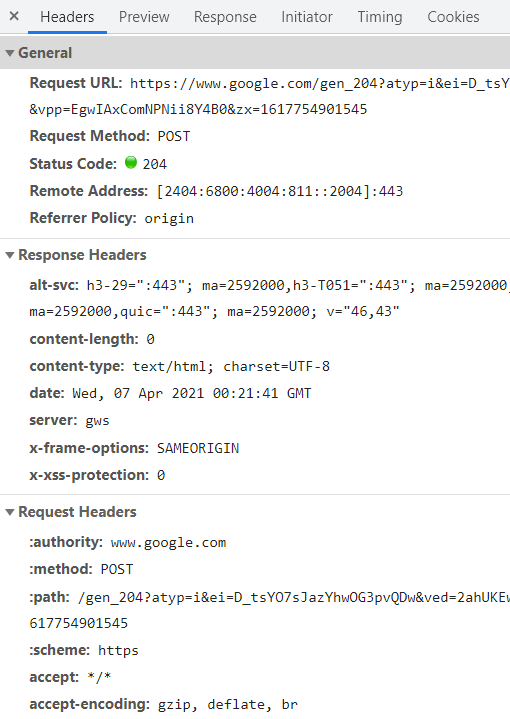
(P1) See sent headers when the opening handshake succeeded or failed.
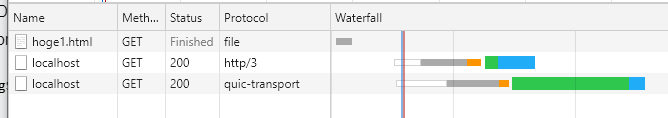
(P1) Watch Http3/Quic connections
start/connect/abort
(P2) Watch send/receive streams over the connections
start/abort
Network timeline (P1)
The network timeline covers the scenario #1 and #2.
When a WebTransport object is created with a URL, we start a Http3/Quic connection. Then the network timeline lists the connection.
Each item shows
URL
protocol
Headers of opening handshake
An item is alive when the associated connection is alive.
Waterfall bars might show colors depending on its state (handshaking, streaming and abort)
WebTransport Streams viewer (P2)
For scenario #3, we will show streams associated with each connection in another new panel like WebSocket.
(or should they also be shown in the above network timeline?)
Unlike WebSocket, one connection can have two or more streams.
OutgoingStream
OutgoingStream has a WritableStream to send data to the server
Lifecycle waterfall
Created/ Abort (StreamAbortInfo)
IncomingStream
IncomingStream has a ReadableStream to receive data from the server
Lifecycle waterfall
Created/ Abort (StreamAbortInfo)
BidirectionalStreams
BidirectionalStream has an OutgoingStream and an IncomingStream.
Datagram WritableStream
Datagram ReadableStream
Yoichi Osato
- I'm a Chrome engineer and I'd like to implement a new feature on Devtools to support WebTransport debugging as Yutaka proposed.
- Above is the current design I have.
- I would appreciate any feedback on the design, especially if you're a current WebTransport user. To make our discussion productive, please feedback at https://bit.ly/3ig8BLi.

Yutaka Hirano
--
You received this message because you are subscribed to the Google Groups "web-transport-dev" group.
To unsubscribe from this group and stop receiving emails from it, send an email to web-transport-...@chromium.org.
To view this discussion on the web visit https://groups.google.com/a/chromium.org/d/msgid/web-transport-dev/CAAEV3pm0ZtR%2Bi14k54StiunG%2B1FWOi-ah9dC2u96S9md1_9DcA%40mail.gmail.com.

Luke Curley
To view this discussion on the web visit https://groups.google.com/a/chromium.org/d/msgid/web-transport-dev/CABihn6FdA93CMd88sPoLJJMr2cvX2C%3DP0noXuRnTswNR-xLnQg%40mail.gmail.com.

Lucas Pardue
It's more difficult, but I would also like to know when specific sections of a stream were transmitted (pipeline case). I seem to remember Wireshark doing something for TCP where it would show you the entire stream, and you could click on an individual packet to overlay the offset+size bounding box. To translate that idea to QUIC, you could render each STREAM frame (or cluster) on the timeline to both demonstrate spurious network activity, and allow zooming in to see the specific contents (kind of like a trace)
Yoichi Osato
Yutaka Hirano
Lucas Pardue
Yoichi Osato
Luke Curley

Robin MARX
Yutaka Hirano
Hello all,Sorry I'm late to the party on this. I am the developer of the QUIC tools Lucas mentioned earlier (https://qvis.edm.uhasselt.be/) and have some thoughts on this.a) I'm not sure what you mean above Yutaka, when you say "for h2 and h3 one row corresponds to one stream" ... "for WebTransport, there is one handshake per transport, not stream".For H2 and H3, there is also only one handshake for multiple streams? So I'm not sure why the existing row-based approach wouldn't work there. Could you give more details?
Yoichi Osato
Thank you very much for your feedback. I’ve decided to list both connections and streams on the network timeline.
We'll show the size and timestamp for each sent/received chunk in a subpanel in the stream view.
Whole design is here: https://bit.ly/3ig8BLi
I'll start implementing the feature, but we'll continue appreciating your feedback and suggestions.
Cheers.
Robin MARX
Yoichi Osato
Yoichi Osato