GLES2::ReadPixels stalling graphics pipeline
1,353 views
Skip to first unread message

Shukant Pal
May 13, 2022, 9:28:41 PM5/13/22
to Graphics-dev
Hello,
As a part of our automated performance testing, we run Chrome's tracing in our CI. We are noticing that 100ms+ duration calls to GLES2::ReadPixels after the first 10-12 seconds are causing frames to drop. We aren't sure why ReadPixels is being called at all, and wanted to know how we can find the root cause of this.
As a part of our automated performance testing, we run Chrome's tracing in our CI. We are noticing that 100ms+ duration calls to GLES2::ReadPixels after the first 10-12 seconds are causing frames to drop. We aren't sure why ReadPixels is being called at all, and wanted to know how we can find the root cause of this.
Sample traces:
Shukant Pal
May 16, 2022, 7:52:28 PM5/16/22
to Graphics-dev, Shukant Pal
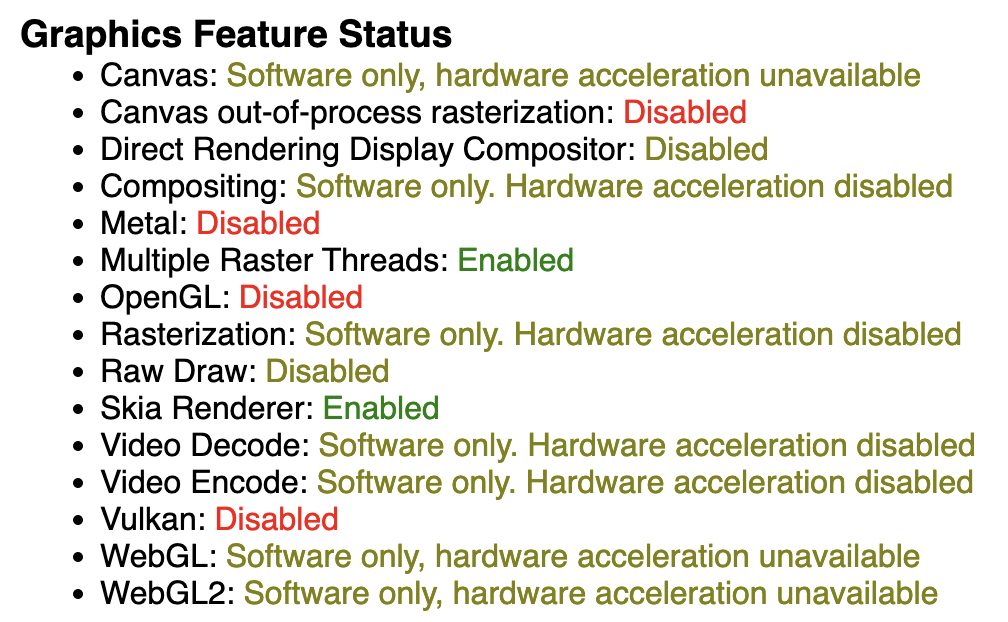
Note that our CI computer works on software rendering. Here's the about://gpu information:
Graphics Feature Status
Canvas: Software only, hardware acceleration unavailable Canvas out-of-process rasterization: Disabled
Direct Rendering Display Compositor: Disabled Compositing: Software only. Hardware acceleration disabled Multiple Raster Threads: Enabled
OpenGL: Disabled
Rasterization: Software only. Hardware acceleration disabled Raw Draw: Disabled
Skia Renderer: Enabled
Video Decode: Software only. Hardware acceleration disabled Video Encode: Software only. Hardware acceleration disabled Vulkan: Disabled
WebGL: Software only, hardware acceleration unavailable WebGL2: Software only, hardware acceleration unavailable

Zhenyao Mo
May 16, 2022, 11:44:03 PM5/16/22
to Shukant Pal, Graphics-dev
The reason from time to time ReadPixels takes a long time is the GPU
side CommandBufferService::Flush() takes a long time, but CPU time is
small, mostly it's wall time. Likely waiting for the commands to
finish so you can read back the pixels.
ReadPixels() is coming from a WebGL context, so it's your code?
side CommandBufferService::Flush() takes a long time, but CPU time is
small, mostly it's wall time. Likely waiting for the commands to
finish so you can read back the pixels.
ReadPixels() is coming from a WebGL context, so it's your code?
Shukant Pal
May 17, 2022, 12:02:01 AM5/17/22
to Zhenyao Mo, Graphics-dev
Thanks for the response!
> ReadPixels() is coming from a WebGL context, so it's your code?
That’s what is perplexing us. We don’t call gl.readPixels anywhere in our code so we assumed it was something inside Chromium. I will double check by overriding gl.readPixels to sanity check that nothing in our app is calling gl.readPixels
> ReadPixels() is coming from a WebGL context, so it's your code?
Zhenyao Mo
May 17, 2022, 12:13:17 AM5/17/22
to Shukant Pal, Graphics-dev
On Mon, May 16, 2022 at 8:54 PM Shukant Pal <shu...@teamflowhq.com> wrote:
>
> Thanks for the response!
>
> > ReadPixels() is coming from a WebGL context, so it's your code?
>
> That’s what is perplexing us. We don’t call gl.readPixels anywhere in our code so we assumed it was something inside Chromium. I will double check by overriding gl.readPixels to sanity check that nothing in our app is calling gl.readPixels
It's definitely from a WebGL context, but it doesn't have to be
>
> Thanks for the response!
>
> > ReadPixels() is coming from a WebGL context, so it's your code?
>
> That’s what is perplexing us. We don’t call gl.readPixels anywhere in our code so we assumed it was something inside Chromium. I will double check by overriding gl.readPixels to sanity check that nothing in our app is calling gl.readPixels
gl.readPixels(). For example, it can be getImage(), or toDataURL, etc.
In other words, you are trying to get pixels out of the webgl canvas.
Shukant Pal
May 17, 2022, 9:25:17 AM5/17/22
to Zhenyao Mo, Graphics-dev
That makes sense. Is there a way for us to get a stack trace from the JavaScript side to find what exactly is calling GLES2::ReadPixels in the browser? If not, is there some resource listing all the different methods that could possibly cause GLES2::ReadPixels (apart from gl.readPixels, getImageData, toDataURL)?
Shukant Pal
May 17, 2022, 11:39:24 AM5/17/22
to Zhenyao Mo, Graphics-dev
We’ve done some further investigation and we think it’s something in the software rendering stack that is causing ReadPixels. We ran a trace against the PixiJS bunnymark and we see ReadPixels calls inside DoUpdateLayers there as well. It seems as if anything rendering to a canvas is being read back when updating the canvas layer.


Justin Novosad
May 17, 2022, 11:43:19 AM5/17/22
to Shukant Pal, Zhenyao Mo, Graphics-dev
If you can find the client-side (Renderer process) call site where you would like to get a Javascript callstack, you can do it. You need access to to the current execution context.
- Calling toDataURL() on a canvas that is GPU-accelerated
- Calling toBlob() on a canvas that is GPU-accelerated
- Calling getImageData() on a 2d context that is GPU-accelerated
- Calling drawImage() with a source image that is GPU-accelerated on a 2d context that is *not* GPU-accelerated
- Creating a CanvasPattern from a source image that is GPU-accelerated
FYI:
- A "canvas that is GPU-accelerated" can be of any context type. WebGL and WebGPU contexts are always gpu-accelerated, 2d and bitmaprenderer contexts can be either GPU-accelerated or not.
- A "source image that is GPU-accelerated" is either another canvas or an ImageBitmap object that was created from a GPU-accelerated canvas.
- To force a 2d-context to not be GPU-accelerated, you can use the willReadFrequently context creation parameter. This is a hint to the browser to tell it to optimize for frequent readbacks, which essentially means "do not use the GPU". Ex: const ctx = canvas.getContext('2d', {willReadFrequently: true});
- When willReadFrequently is not specified, Chrome uses an heuristic that wil disable GPU-acceleration after the first readback. This means that only the first call to getImageData, for example, will result in a call to GL's ReadPixels.
Justin Novosad
May 17, 2022, 11:46:03 AM5/17/22
to Shukant Pal, Zhenyao Mo, Graphics-dev
That trace shows a ReadPixel that is not happening in the scope of JS execution.
This is surprising. Can you share a reduced test case that reproduces this?
Justin Novosad
May 17, 2022, 11:48:26 AM5/17/22
to Shukant Pal, Zhenyao Mo, Graphics-dev
Actually, nevermind the reduced test case, I will investigate this using the PixiJS bunnymark.

Kyle Charbonneau
May 17, 2022, 11:55:36 AM5/17/22
to Justin Novosad, Shukant Pal, Zhenyao Mo, Graphics-dev
We’ve done some further investigation and we think it’s something in the software rendering stack that is causing ReadPixels.
I think that is expected with software rendering. The software renderer needs pixels in main memory. WebGL rendering is typically done on the GPU in GPU memory, so WebGL commands are executed on the GPU and the results are read back into main memory to be presented via SoftwareRenderer. I think that works the same with SwiftShader WebGL. Could the GPU main thread be blocked on a SwiftShader thread doing WebGL rendering?
Kyle Charbonneau
May 17, 2022, 12:13:02 PM5/17/22
to Shukant Pal, Justin Novosad, Zhenyao Mo, Graphics-dev, Alexis Hétu, Nicolas Capens
Forgive my ignorance here but if “WebGL” is in software-only mode, doesn’t that mean it’s not running on a GPU?
So yes, swiftshader provides a GL implementation that runs on the CPU. Swiftshader is still accessed via GLES API though so you need to do something like glReadPixels() to get a memory address for the pixels. Doing read pixels is cheap, probably just a memcpy (assuming no format conversion is required) but swiftshader needs to finish the WebGL rendering before the copy which is going to be slower than a real GPU.
I'm not sure if there is a way to get swiftshader threads in a Chrome trace but that would help confirm.
On Tue, May 17, 2022 at 11:59 AM Shukant Pal <shu...@teamflowhq.com> wrote:
Forgive my ignorance here but if “WebGL” is in software-only mode, doesn’t that mean it’s not running on a GPU?

On May 17, 2022, at 11:54 AM, Kyle Charbonneau <kyle...@chromium.org> wrote:
We’ve done some further investigation and we think it’s something in the software rendering stack that is causing ReadPixels.I think that is expected with software rendering. The software renderer needs pixels in main memory. WebGL rendering is typically done on the GPU in GPU memory, so WebGL commands are executed on the GPU and the results are read back into main memory to be presented via SoftwareRenderer. I think that works the same with SwiftShader WebGL. Could the GPU main thread be blocked on a SwiftShader thread doing WebGL rendering?
On Tue, May 17, 2022 at 11:46 AM Justin Novosad <ju...@chromium.org> wrote:
That trace shows a ReadPixel that is not happening in the scope of JS execution.This is surprising. Can you share a reduced test case that reproduces this?
On Tue, May 17, 2022 at 11:39 AM Shukant Pal <shu...@teamflowhq.com> wrote:
We’ve done some further investigation and we think it’s something in the software rendering stack that is causing ReadPixels. We ran a trace against the PixiJS bunnymark and we see ReadPixels calls inside DoUpdateLayers there as well. It seems as if anything rendering to a canvas is being read back when updating the canvas layer.
<Screen Shot 2022-05-17 at 11.24.59 AM.png>
Shukant Pal
May 17, 2022, 12:13:36 PM5/17/22
to Kyle Charbonneau, Justin Novosad, Zhenyao Mo, Graphics-dev
Forgive my ignorance here but if “WebGL” is in software-only mode, doesn’t that mean it’s not running on a GPU?
On May 17, 2022, at 11:54 AM, Kyle Charbonneau <kyle...@chromium.org> wrote:
We’ve done some further investigation and we think it’s something in the software rendering stack that is causing ReadPixels.I think that is expected with software rendering. The software renderer needs pixels in main memory. WebGL rendering is typically done on the GPU in GPU memory, so WebGL commands are executed on the GPU and the results are read back into main memory to be presented via SoftwareRenderer. I think that works the same with SwiftShader WebGL. Could the GPU main thread be blocked on a SwiftShader thread doing WebGL rendering?
On Tue, May 17, 2022 at 11:46 AM Justin Novosad <ju...@chromium.org> wrote:
That trace shows a ReadPixel that is not happening in the scope of JS execution.This is surprising. Can you share a reduced test case that reproduces this?
On Tue, May 17, 2022 at 11:39 AM Shukant Pal <shu...@teamflowhq.com> wrote:
We’ve done some further investigation and we think it’s something in the software rendering stack that is causing ReadPixels. We ran a trace against the PixiJS bunnymark and we see ReadPixels calls inside DoUpdateLayers there as well. It seems as if anything rendering to a canvas is being read back when updating the canvas layer.
<Screen Shot 2022-05-17 at 11.24.59 AM.png>
Shukant Pal
May 17, 2022, 12:13:41 PM5/17/22
to Justin Novosad, Zhenyao Mo, Graphics-dev
Thanks Justin. I did some digging myself and studied Chromium’s source code a bit. I have a strong suspicion that it is the following call stack leading to this:
LayerTreeHost::DoUpdateLayers
TextureLayer::Update
DrawingBuffer::PrepareTransferableResource (as TextureLayerClient)
DrawingBuffer::PrepareTransferableResourceInternal
DrawingBuffer::FinishPrepareTransferableResourceSoftware
DrawingBuffer::ReadFramebufferIntoBitmapPixels (in !IsUsingGpuCompositing() && !force_gpu_result branch)
DrawingBuffer::ReadBackFramebuffer
GLES2::ReadPixels
On May 17, 2022, at 11:48 AM, Justin Novosad <ju...@chromium.org> wrote:
Actually, nevermind the reduced test case, I will investigate this using the PixiJS bunnymark.
On Tue, May 17, 2022 at 11:45 AM Justin Novosad <ju...@chromium.org> wrote:
That trace shows a ReadPixel that is not happening in the scope of JS execution.This is surprising. Can you share a reduced test case that reproduces this?
On Tue, May 17, 2022 at 11:39 AM Shukant Pal <shu...@teamflowhq.com> wrote:
We’ve done some further investigation and we think it’s something in the software rendering stack that is causing ReadPixels. We ran a trace against the PixiJS bunnymark and we see ReadPixels calls inside DoUpdateLayers there as well. It seems as if anything rendering to a canvas is being read back when updating the canvas layer.
<Screen Shot 2022-05-17 at 11.24.59 AM.png>
Reply all
Reply to author
Forward
0 new messages