Debugging a Mojo Sync API
306 views
Skip to first unread message

Ravikiran R
Jun 21, 2021, 11:25:01 PM6/21/21
to chromium-mojo
Hello,
On our chromium based browser, we have a exposed a custom API from Renderer (JS context can call it) over a mojo sync API. The interface has other Async APIs and all of them work fine.
But the Sync API which has to return a sync result never returns thus blocking the JS main thread. On the remote side, we do see the API being called and we also call the response callback that has the result of the sync API.
Is there a way, (like a specific --vmodule) I can debug what is happening. I am not 100% sure, but I do see this:
DVLOG(1) << "Dropping message for unknown peer: " << name;
I also have put a "connection error callback", but I don't see connection being dropped.
Any ideas on how I could debug this issue ?
-Ravi

Ken Rockot
Jun 22, 2021, 11:22:35 AM6/22/21
to Ravikiran R, chromium-mojo
On Mon, Jun 21, 2021 at 8:25 PM Ravikiran R <kenz...@gmail.com> wrote:
Hello,On our chromium based browser, we have a exposed a custom API from Renderer (JS context can call it) over a mojo sync API. The interface has other Async APIs and all of them work fine.But the Sync API which has to return a sync result never returns thus blocking the JS main thread. On the remote side, we do see the API being called and we also call the response callback that has the result of the sync API.Is there a way, (like a specific --vmodule) I can debug what is happening. I am not 100% sure, but I do see this:DVLOG(1) << "Dropping message for unknown peer: " << name;
This generally implies that some process has died or been disconnected, but it's unlikely to be relevant here since the browser and this renderer appear to still be connected.
I also have put a "connection error callback", but I don't see connection being dropped.
If the interface were disconnected then the sync call would be interrupted anyway, so that's probably not happening.
Any ideas on how I could debug this issue ?
I assume you've confirmed with a debugger that the renderer is actually still just waiting for the sync IPC reply? It would be good to make certain that something else didn't wake up the sync wait and start a nested sync wait of its own. This can happen if, for example, you also have sync IPCs going from the browser to the renderer.
It's also worth confirming that the IO thread in both the browser and renderer processes is not blocked on something.
Failing that, I'm curious what platform you're observing this behavior on.
-Ravi--
You received this message because you are subscribed to the Google Groups "chromium-mojo" group.
To unsubscribe from this group and stop receiving emails from it, send an email to chromium-moj...@chromium.org.
To view this discussion on the web visit https://groups.google.com/a/chromium.org/d/msgid/chromium-mojo/e8ee7509-87bb-4469-bb89-39f9895763dfn%40chromium.org.
Ravikiran R
Jun 27, 2021, 3:08:09 PM6/27/21
to Ken Rockot, chromium-mojo
Ken,
Thanks for the response.
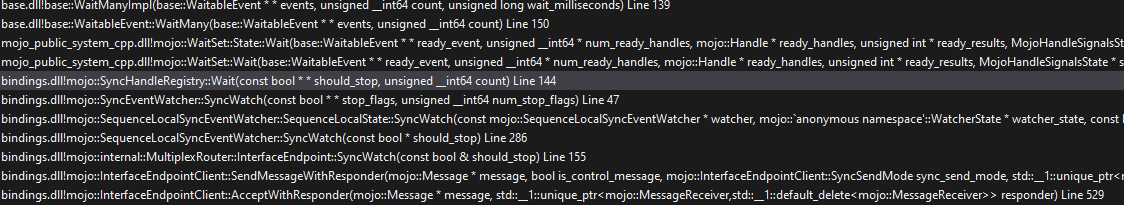
I have confirmed the Sync IPC is indeed waiting on my TestSync API call.
This is the call stack of MainThread of Renderer from a debugger.
It originates from my experimental TestSync API that returns a simple string response.
Failing that, I'm curious what platform you're observing this behavior on.
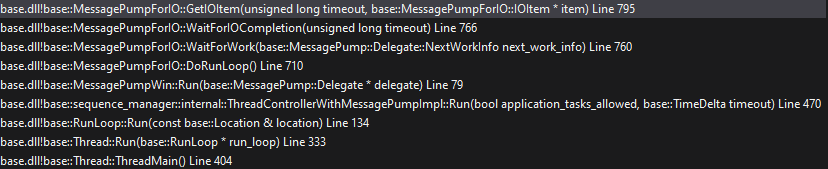
While chrome_childIOThread of Renderer is waiting here
Also another thing I confirmed, that: The JS and corresponding App/Browser are both calling local and remote methods on Main thread.
The pending receiver which is received from Renderer is bound to Local Service on App/Browser on main thread.
On the browser/Application side, it is waiting on MainRunloop.
Ken: Failing that, I'm curious what platform you're observing this behavior on.
Ravi>>FYI, I am seeing that behavior on Windows platform.
regards,
Ravi
Reply all
Reply to author
Forward
0 new messages