Important updates to the CrUX Dashboard
69 views
Skip to first unread message

Rick Viscomi
May 28, 2020, 12:58:30 AM5/28/20
to chrome-ux-report-announce
Hi everyone,
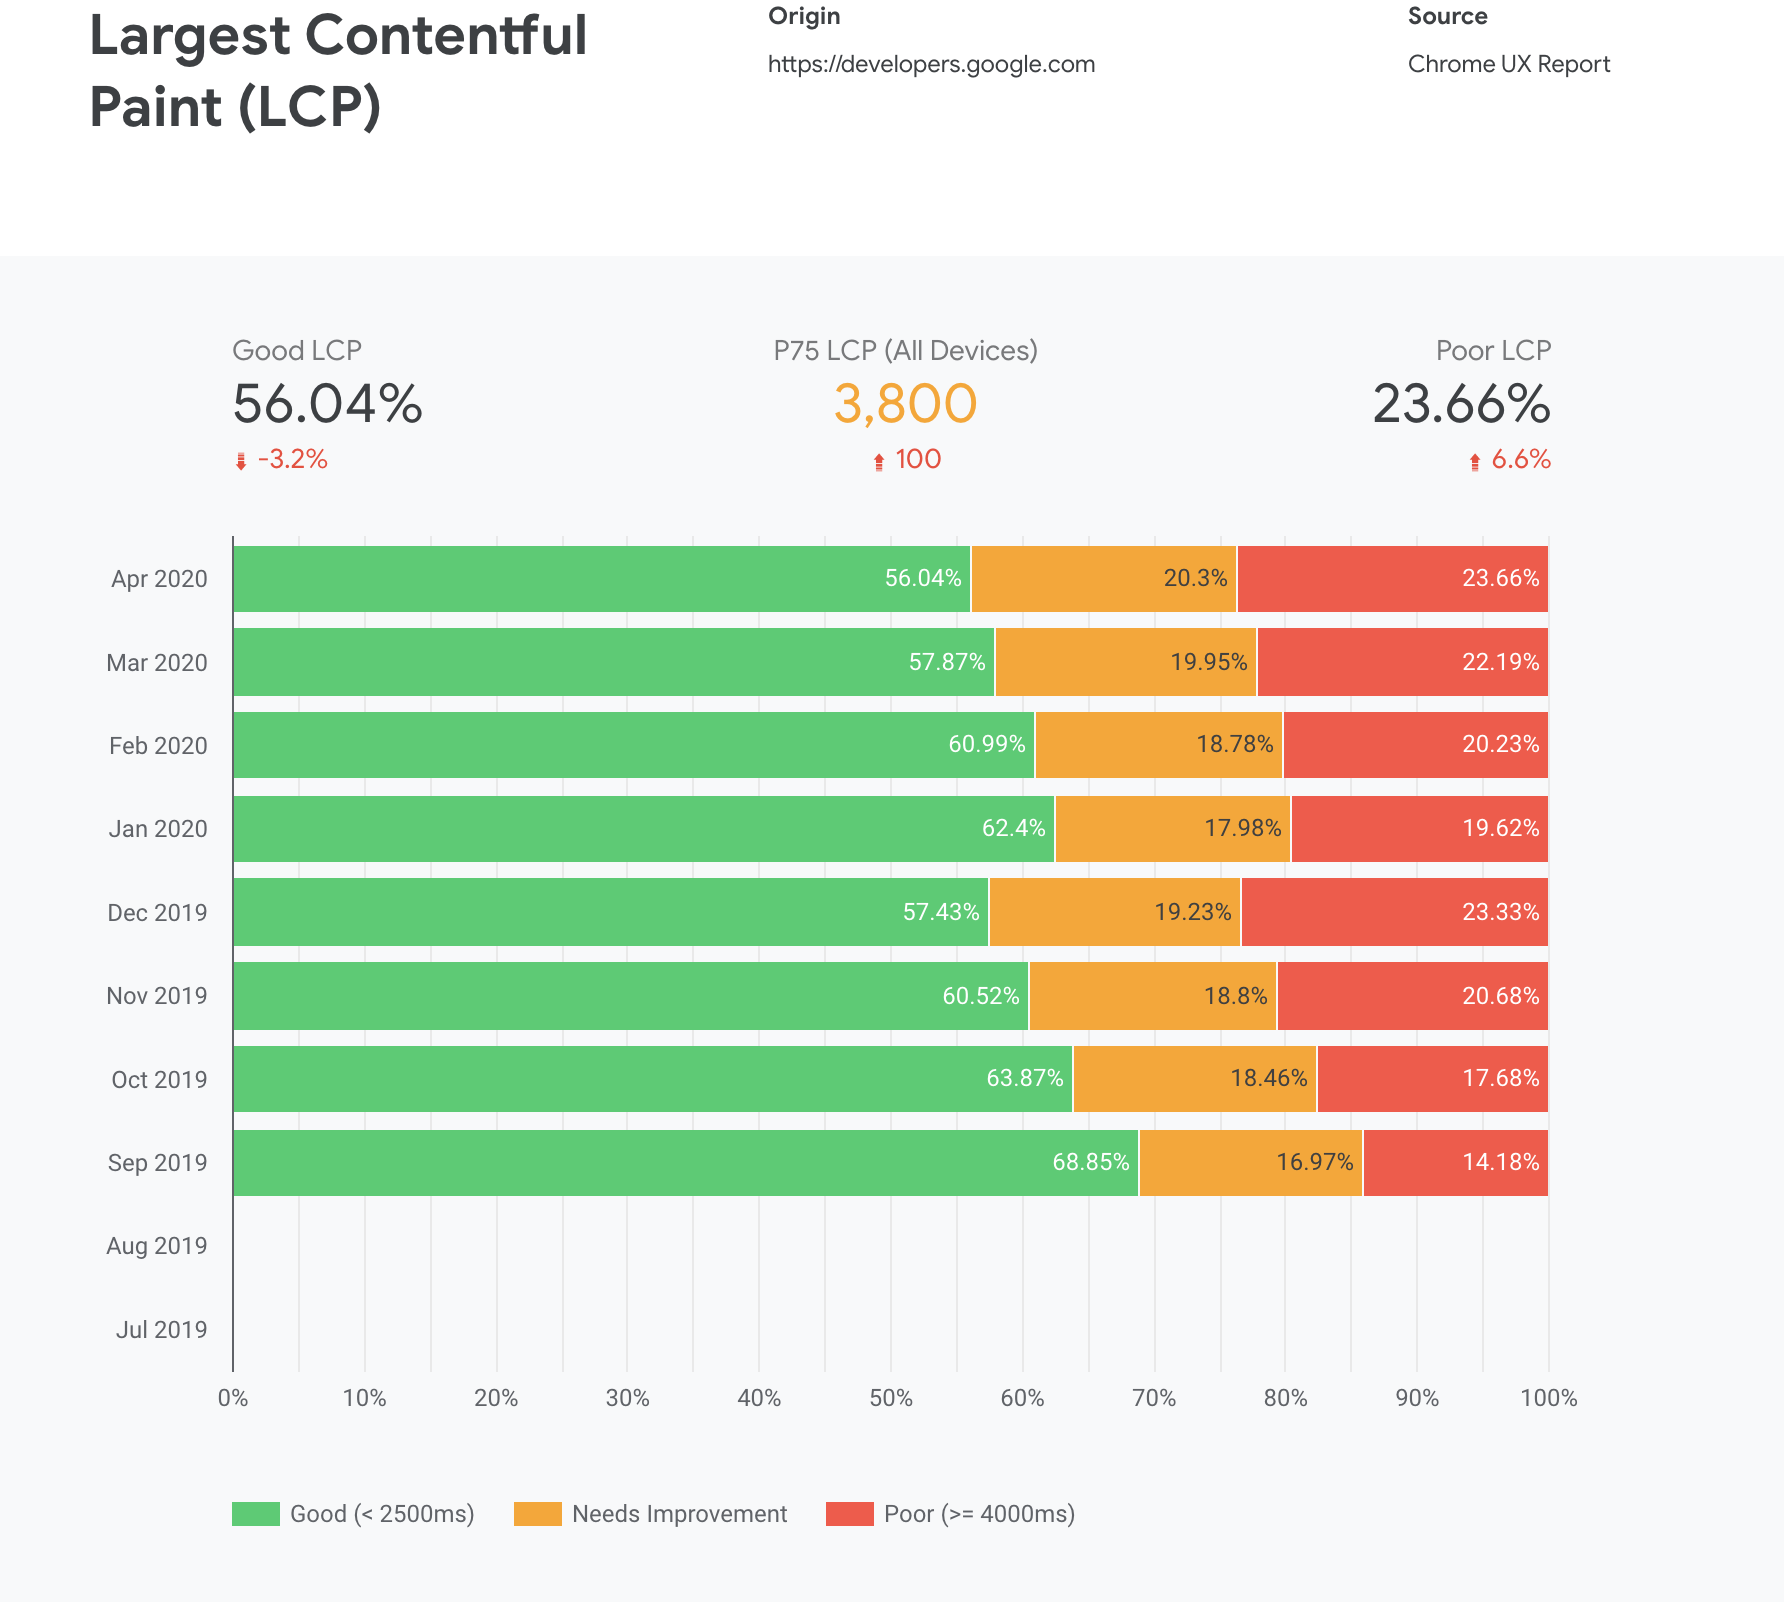
Today we released a big update to the CrUX Dashboard. It's a tool that helps you monitor real-user UX trends with no code/queries required, making it great for developers, execs, and SEOs alike.
To give it a try, visit g.co/chromeuxdash. If you need any help getting set up, this (now outdated) guide has a still-relevant walkthrough to get you up and running.
Here's what included in today's update:
+ first-class support for Core Web Vitals
+ ability to drill down into desktop/phone experiences
+ many UX improvements
Important note for existing CrUX Dash users: your older dashboards will continue to work but the densities might not add up to 100% for some charts. If you haven't made any major customizations to your dashboard, start over from g.co/chromeuxdash to generate a new dashboard with the latest features and UI.
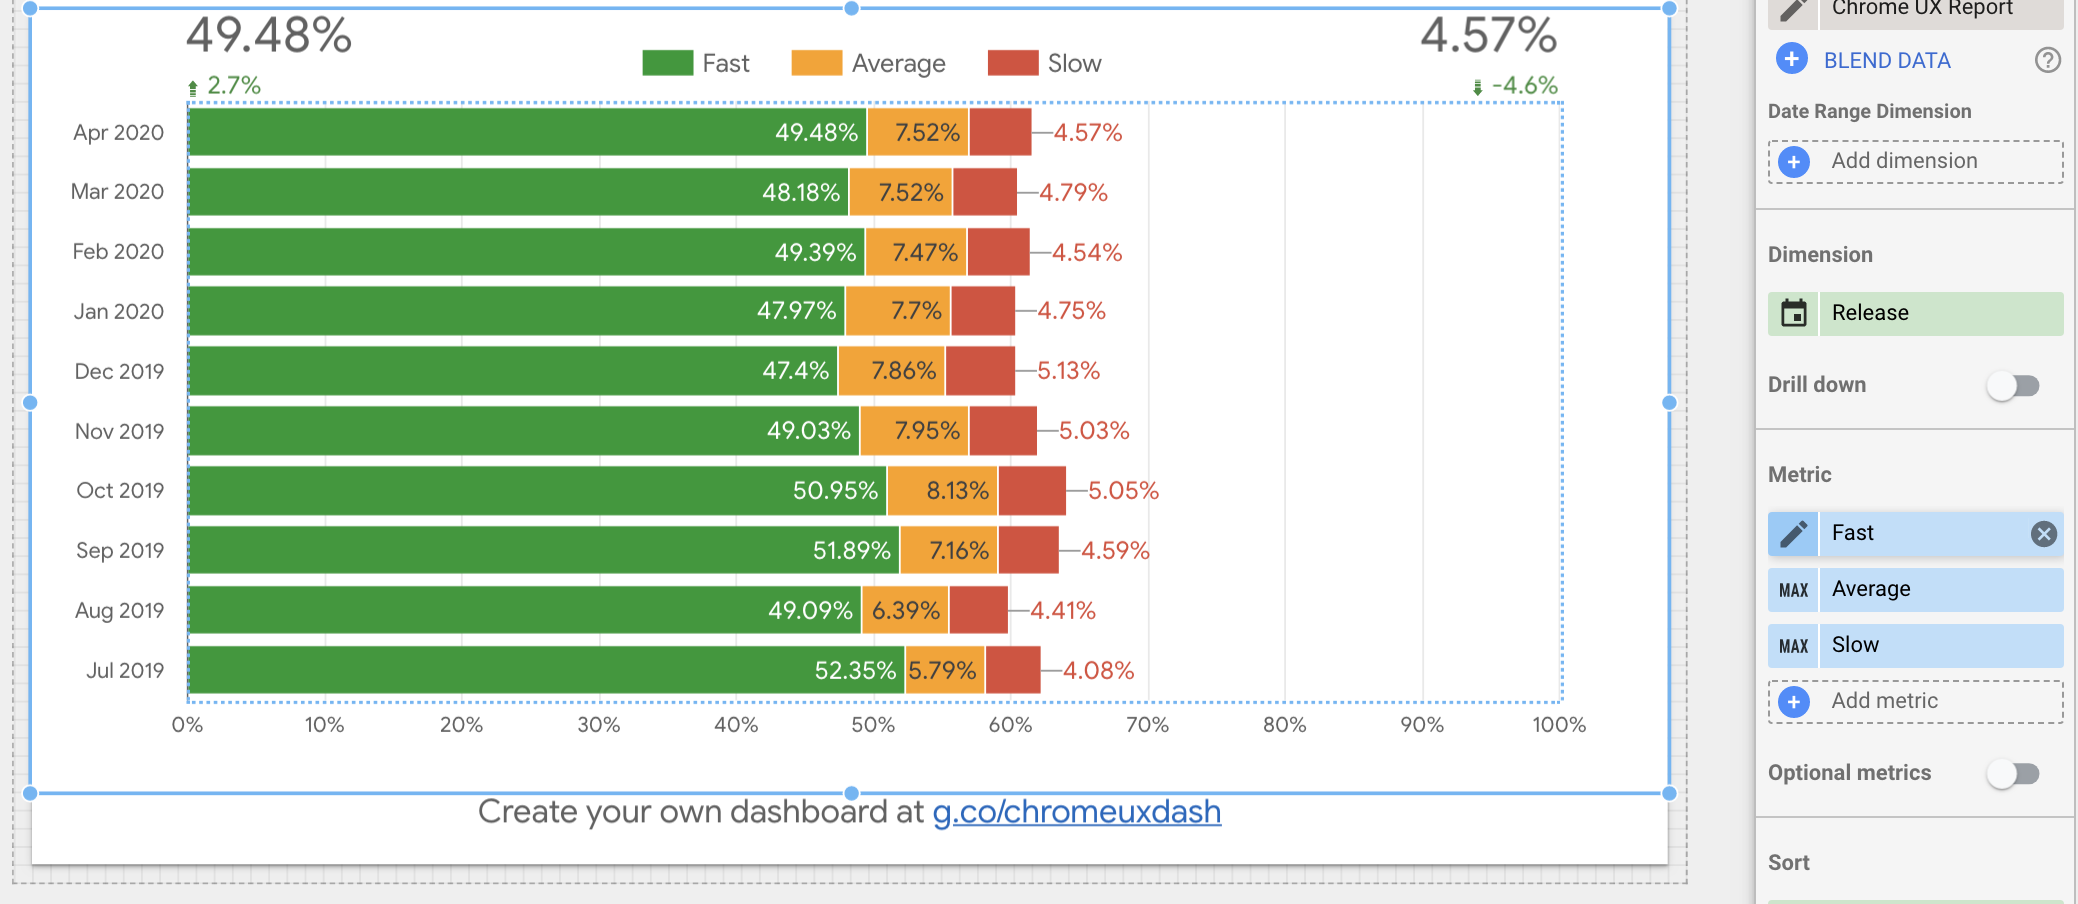
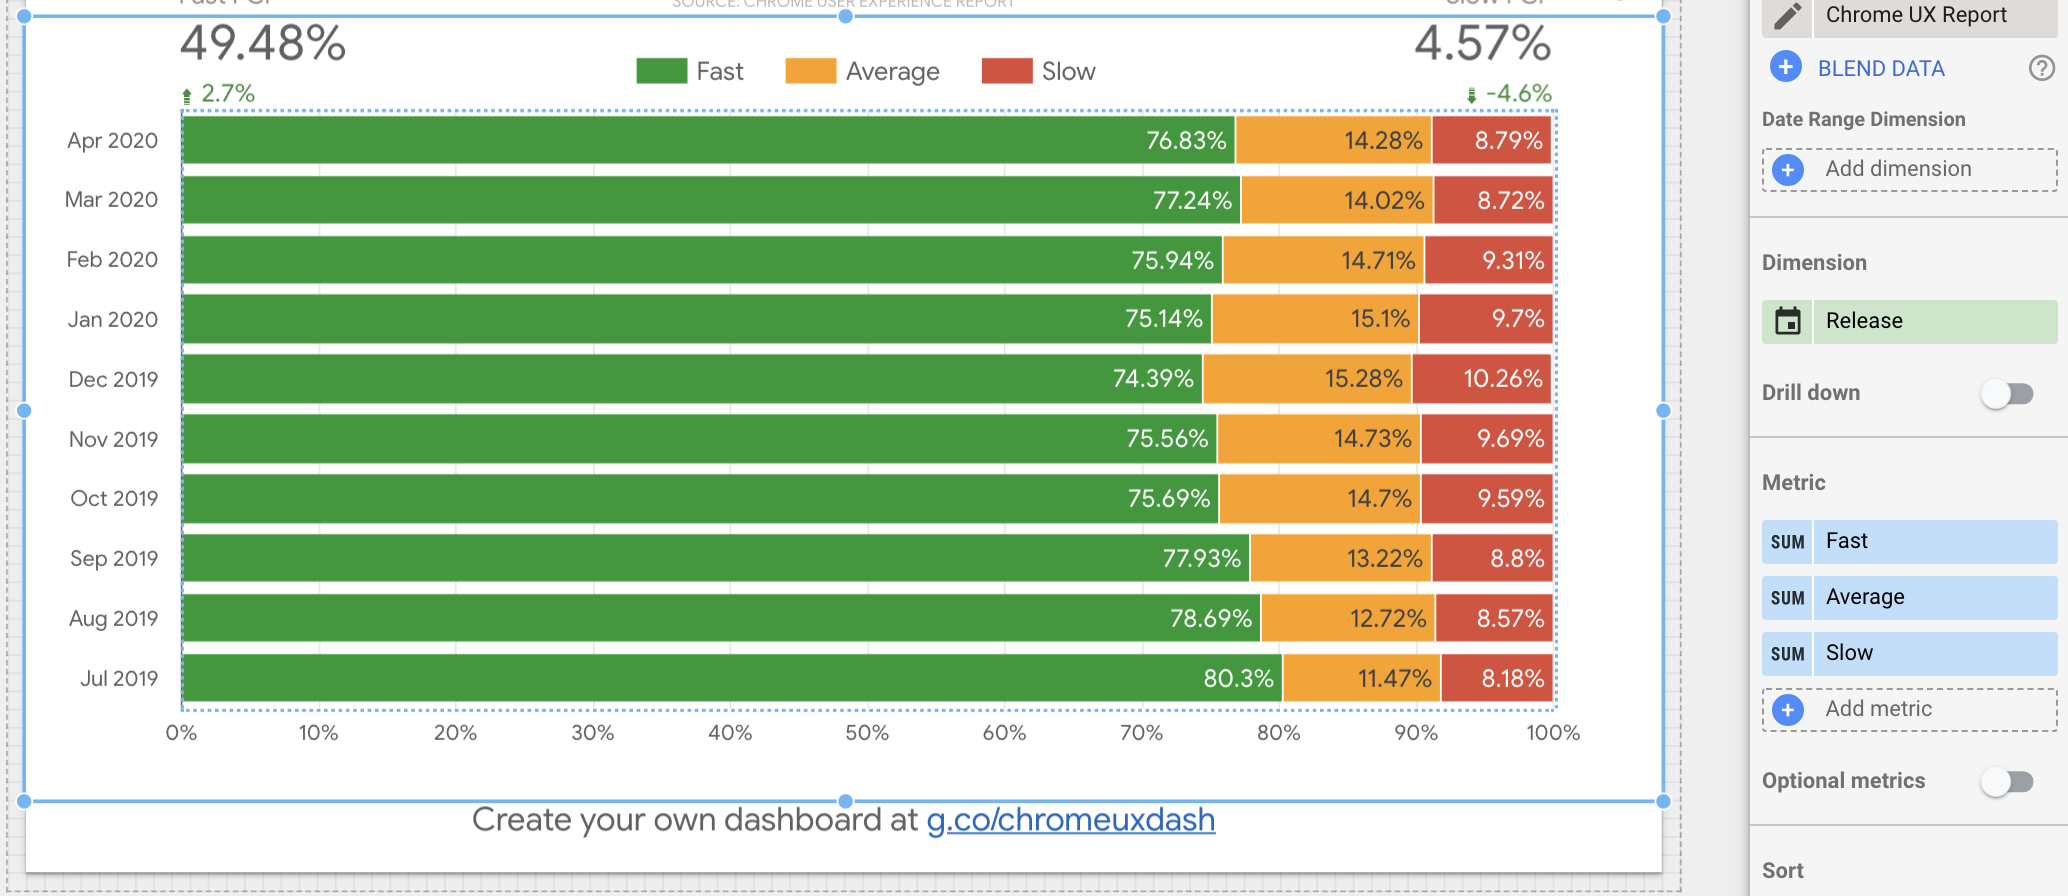
Or if you'd prefer to keep your old dashboards, there's a workaround. In the editor, select the chart and for each Fast/Average/Slow metric click the pencil over "MAX" to change the aggregation function from MAX to SUM. Voila!
If you have any feedback or issues with the new or old dashboards, please let us know in the discussion forum or reach us on Twitter at @ChromeUXReport. We'd love to hear what you think!
Cheers,
Rick
Rick Viscomi
May 28, 2020, 3:46:59 PM5/28/20
to chrome-ux-report, chrome-ux-re...@chromium.org, rvis...@google.com
Thank you Aaron!
On Thursday, May 28, 2020 at 9:39:23 AM UTC-4, Aaron Alter wrote:
That's a great question. We initially wanted folks to focus on and optimize the Core Web Vitals, so those metrics were prioritized with P75s. Each of the CWV metric docs on web.dev have explicit percentile recommendations (for example, see LCP), but this isn't the case yet for other metrics like DCL, OL, FP, or TTFB. The FCP docs do recommend optimizing for the 75th percentile, so that might be a good candidate to get the P75 stat added.
Rick
On Thursday, May 28, 2020 at 9:39:23 AM UTC-4, Aaron Alter wrote:
First of all I'd like to say, great job Rick, really apprechiate the updates you guys have made to the CrUX connector!One question thoug: Any chance you're gonna add P75's for all available metrics? Just seems somehow incomplete if they're only available for the core web vitals.CheersAaron
Rick Viscomi
May 29, 2020, 2:01:35 PM5/29/20
to chrome-ux-report, chrome-ux-re...@chromium.org, rvis...@google.com
Thanks, that's helpful feedback.
On Friday, May 29, 2020 at 2:58:30 AM UTC-4, Aaron Alter wrote:
On Friday, May 29, 2020 at 2:58:30 AM UTC-4, Aaron Alter wrote:
Hi RickThanks for the response, makes perfect sense. I'd love to see P75 for FCP as we're using it as a supplemental metric to the Core Web Vitals to gain a bit more insight into the visual loading progression of our sites.Looking forward to the next update :)Cheers
Reply all
Reply to author
Forward
0 new messages