[CrUX Announce] Important updates to the CrUX Dashboard
292 views
Skip to first unread message

'Rick Viscomi' via chrome-ux-report-announce
May 28, 2020, 12:58:33 AM5/28/20
to chrome-ux-report-announce
Hi everyone,
Today we released a big update to the CrUX Dashboard. It's a tool that helps you monitor real-user UX trends with no code/queries required, making it great for developers, execs, and SEOs alike.
To give it a try, visit g.co/chromeuxdash. If you need any help getting set up, this (now outdated) guide has a still-relevant walkthrough to get you up and running.
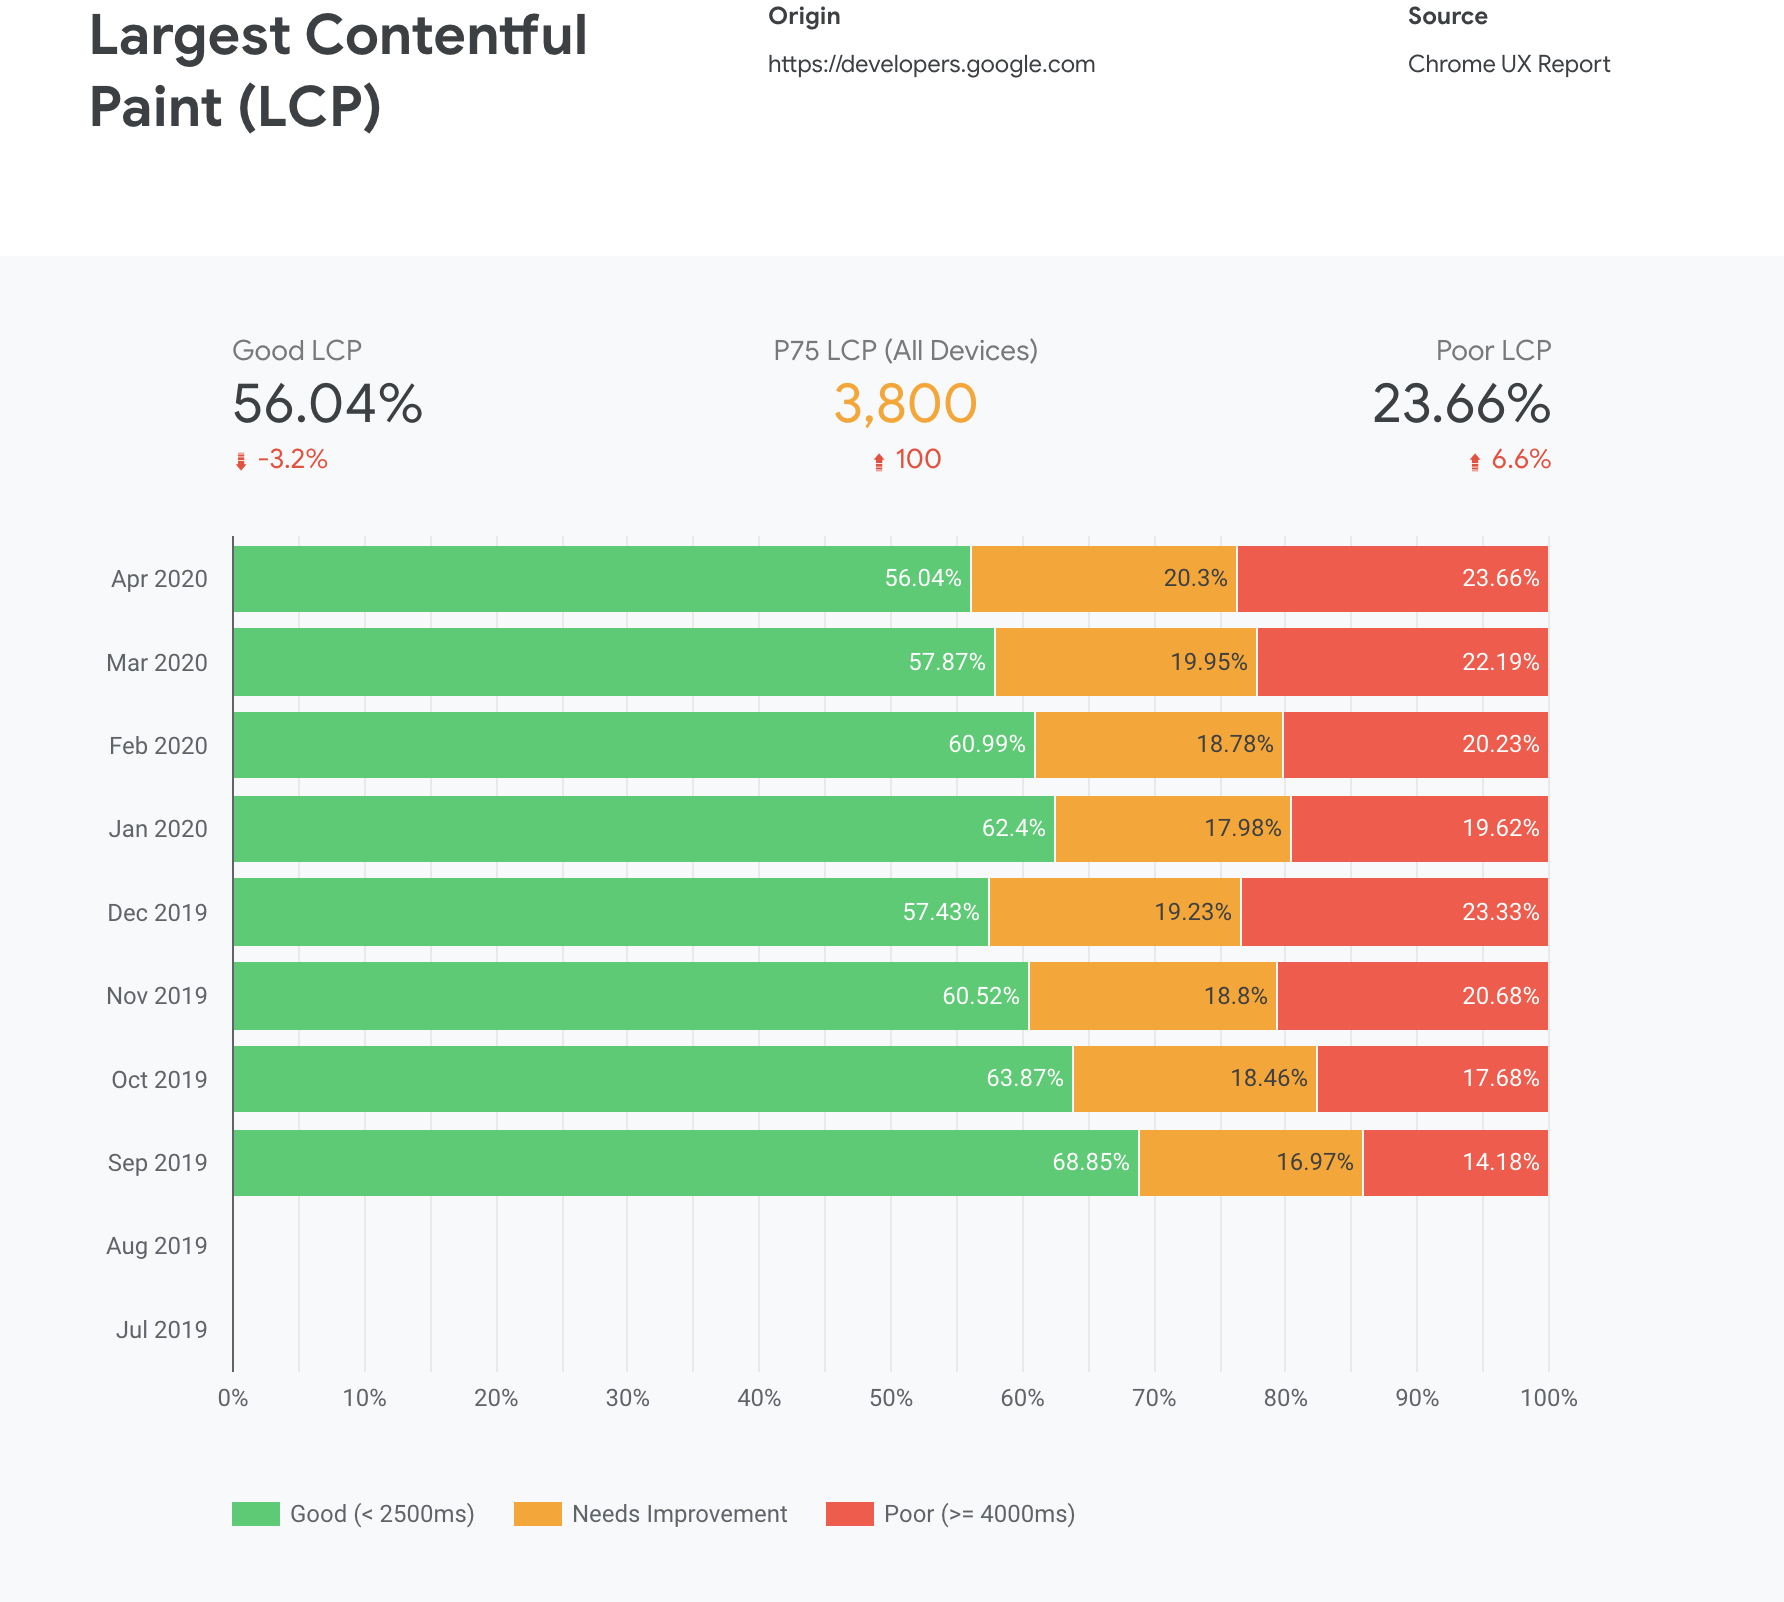
Here's what included in today's update:
+ first-class support for Core Web Vitals
+ ability to drill down into desktop/phone experiences
+ many UX improvements
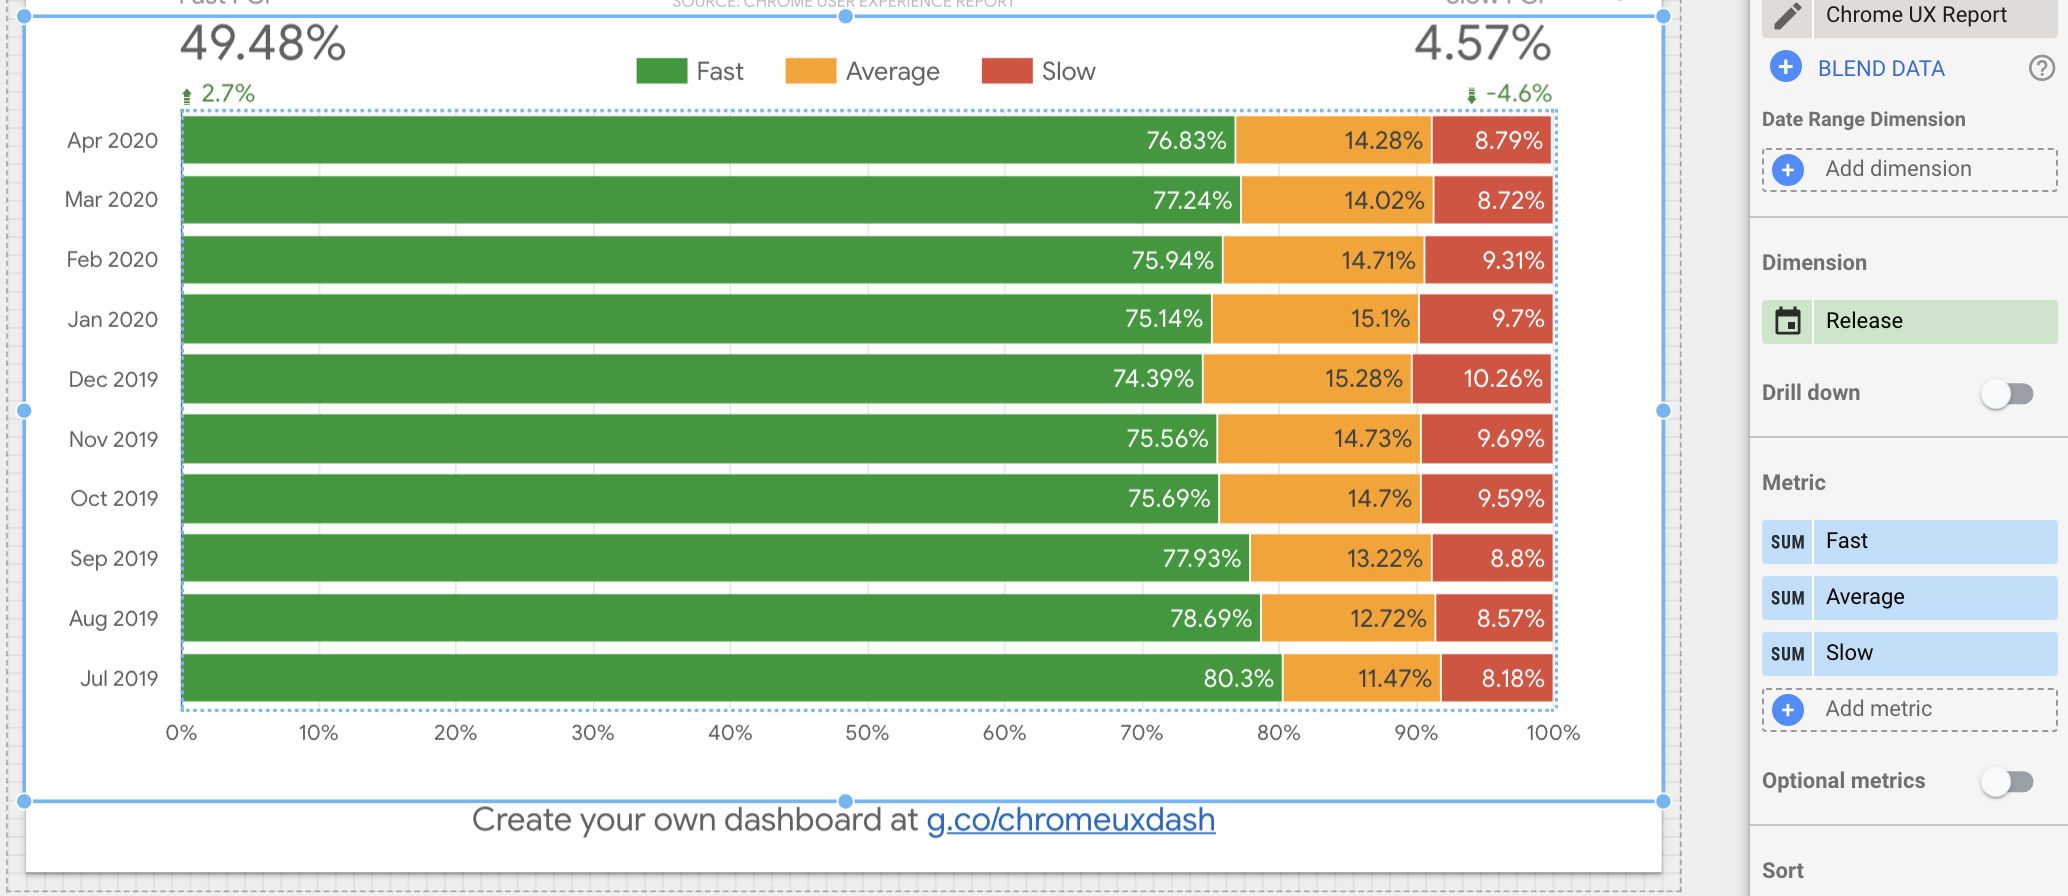
Important note for existing CrUX Dash users: your older dashboards will continue to work but the densities might not add up to 100% for some charts. If you haven't made any major customizations to your dashboard, start over from g.co/chromeuxdash to generate a new dashboard with the latest features and UI.
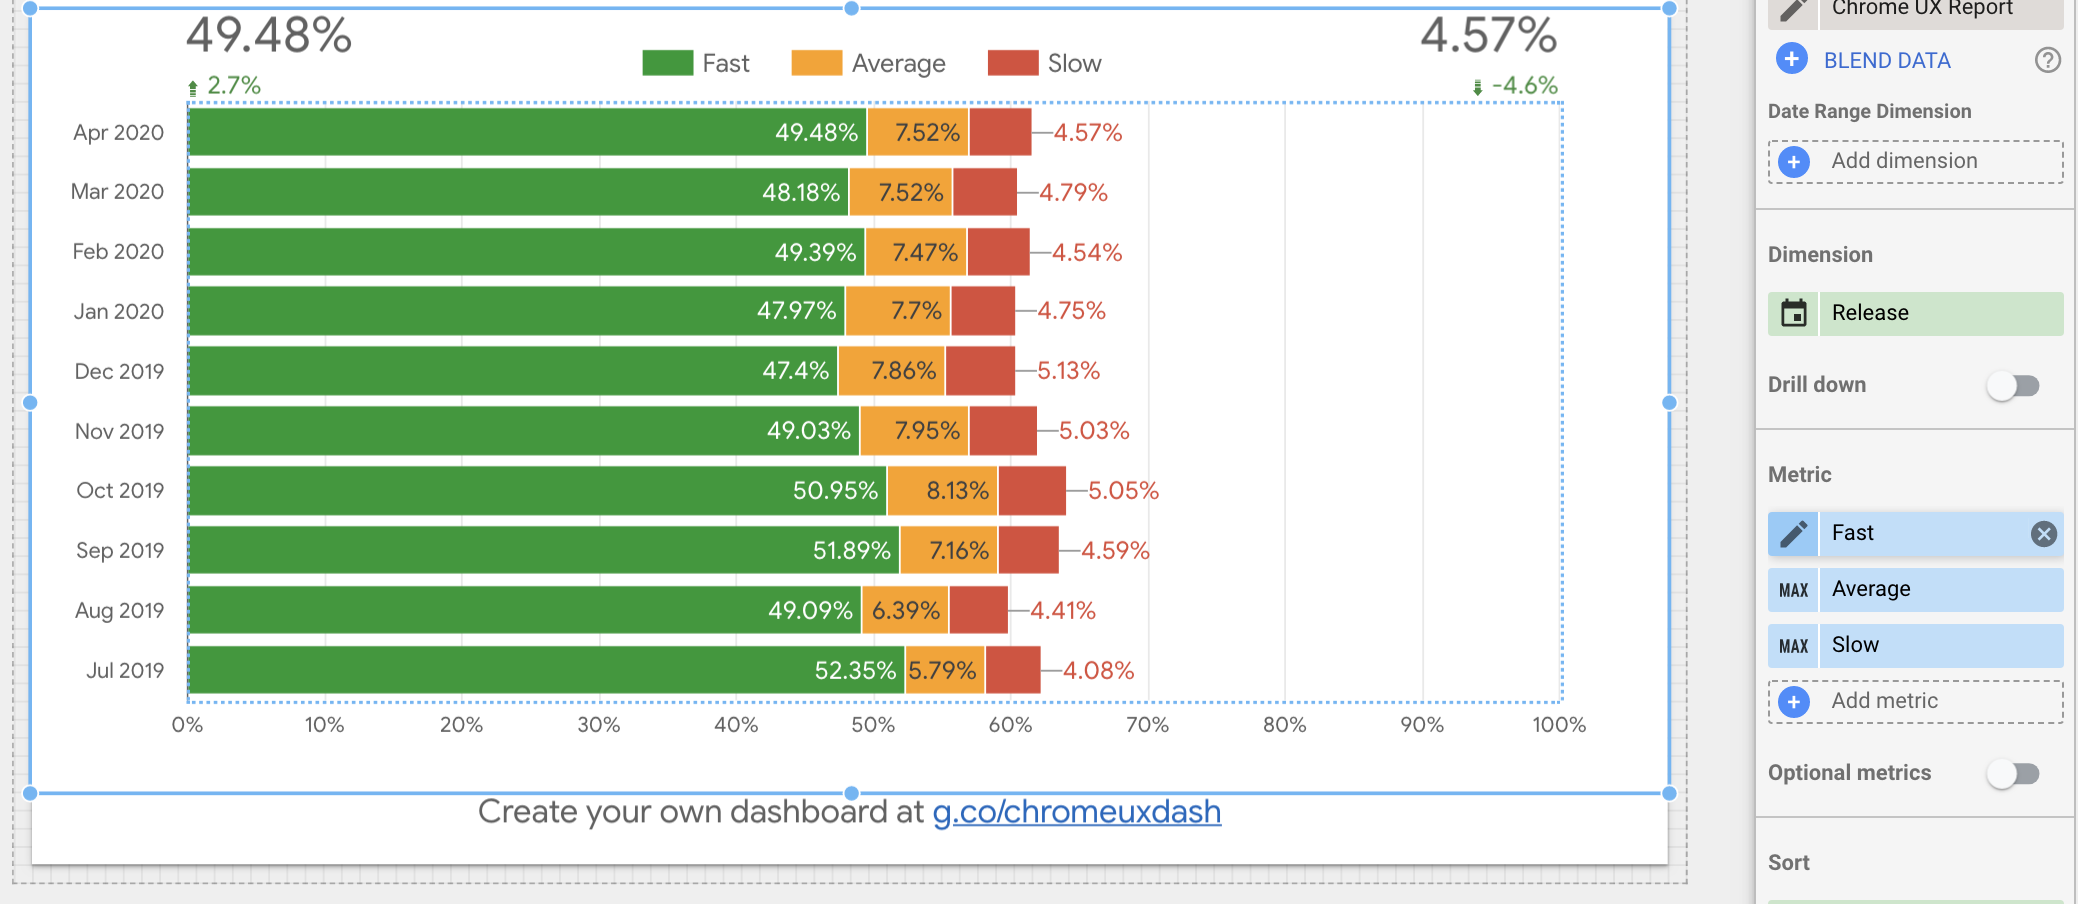
Or if you'd prefer to keep your old dashboards, there's a workaround. In the editor, select the chart and for each Fast/Average/Slow metric click the pencil over "MAX" to change the aggregation function from MAX to SUM. Voila!
If you have any feedback or issues with the new or old dashboards, please let us know in the discussion forum or reach us on Twitter at @ChromeUXReport. We'd love to hear what you think!
Cheers,
Rick

Aaron Alter
May 28, 2020, 9:39:23 AM5/28/20
to chrome-ux-report, chrome-ux-re...@chromium.org, rvis...@google.com
First of all I'd like to say, great job Rick, really apprechiate the updates you guys have made to the CrUX connector!
One question thoug: Any chance you're gonna add P75's for all available metrics? Just seems somehow incomplete if they're only available for the core web vitals.
Cheers
Aaron

Rick Viscomi
May 28, 2020, 3:46:57 PM5/28/20
to chrome-ux-report, chrome-ux-re...@chromium.org, rvis...@google.com
Thank you Aaron!
That's a great question. We initially wanted folks to focus on and optimize the Core Web Vitals, so those metrics were prioritized with P75s. Each of the CWV metric docs on web.dev have explicit percentile recommendations (for example, see LCP), but this isn't the case yet for other metrics like DCL, OL, FP, or TTFB. The FCP docs do recommend optimizing for the 75th percentile, so that might be a good candidate to get the P75 stat added.
Rick
Aaron Alter
May 29, 2020, 2:58:30 AM5/29/20
to chrome-ux-report, chrome-ux-re...@chromium.org, rvis...@google.com
Hi Rick
Thanks for the response, makes perfect sense. I'd love to see P75 for FCP as we're using it as a supplemental metric to the Core Web Vitals to gain a bit more insight into the visual loading progression of our sites.
Looking forward to the next update :)
Cheers
Rick Viscomi
May 29, 2020, 2:01:33 PM5/29/20
to chrome-ux-report, chrome-ux-re...@chromium.org, rvis...@google.com
Thanks, that's helpful feedback.

Joe Hoyle
Jun 1, 2020, 10:51:31 AM6/1/20
to chrome-ux-report, chrome-ux-re...@chromium.org, rvis...@google.com
Hi Rick
You folks are doing a great job to align performance tools and metrics across RUM and synthetic. I just wanted some clarification on how up-to-date the pages were at https://web.dev/lighthouse-performance/. It’s just that if you look at https://web.dev/interactive/ the target RAG rating does not match that of the lighthouse Scoring Calculator at https://googlechrome.github.io/lighthouse/scorecalc/ .
For example the document on TTI specifies that green (Fast) is for 5.2 sec and below. But the calulator goes green at around 3.8 sec.
Kind regards,
Rick Viscomi
Jun 4, 2020, 5:41:48 PM6/4/20
to Joe Hoyle, chrome-ux-report, Brendan Kenny
Hi Joe, thanks for your feedback!
Rick
It seems the TTI doc hasn't been updated yet with the v6 grade scale. I'll pass this on to the Lighthouse team.
Rick
Brendan Kenny
Jun 4, 2020, 6:09:06 PM6/4/20
to chrome-ux-report, joe....@mavens.co.uk, bck...@google.com
Denied the ability to post, but hopefully it works this time :)
Thanks Joe! Looks like that's been a typo for a long time now. I've submitted a fix in https://github.com/GoogleChrome/web.dev/pull/3141
Brendan

Rockey Nebhwani
Jun 6, 2020, 8:29:33 PM6/6/20
to chrome-ux-report, chrome-ux-re...@chromium.org, rvis...@google.com
Hi Rick,
I have a question about Notifications permission section in new dashboards... If a PWA is submitted as a app using Trusted Web Activity in play store, how does this report counts notification permission for those app users? As in TWA, users are auto enrolled in push notifications (that's my understanding)
Thanks,
Rockey
Joe Hoyle
Jun 11, 2020, 11:54:54 AM6/11/20
to chrome-ux-report, joe....@mavens.co.uk, bck...@google.com
There is also a key discrepancy between the thresholds for FCP in PageSpeed Insights and Lighthouse. The documentation at https://developers.google.com/speed/docs/insights/v5/about sets out the thresholds for FCP and Core Web Vitals. For FCP to be classified as good it has to be within 1 second.
When using PageSpeed Insights, if I hover over each of the measurements results for both lab and field after running a test, the message text that appears shows that the thresholds for each of the metrics matches the documentation at https://developers.google.com/speed/docs/insights/v5/about
However, looking at the scoring calculator, at https://googlechrome.github.io/lighthouse/scorecalc/ the classification of ‘good”, “green” actually applies to FCP within 2,360 ms, not 1 second. The ‘good” threshold for CLS and LCP in the lighthouse scoring calculator match the spec set out at ttps://developers.google.com/speed/docs/insights/v5/about
Which is correct? Is the threshold for FCP 1 sec or 2.3 sec?
Documentation at https://web.dev/first-contentful-paint/ specifies 2 sec. I presume this page just needs to be updated.
Rick Viscomi
Jun 11, 2020, 1:13:31 PM6/11/20
to chrome-ux-report, joe....@mavens.co.uk, bck...@google.com
Thank you Joe, that's really good feedback. We're actively working to resolve discrepancies like this across our tools so I'll make sure the right people see this.
Joe Hoyle
Jun 15, 2020, 6:24:15 AM6/15/20
to chrome-ux-report, joe....@mavens.co.uk, bck...@google.com
In case it helps...Lighthouse (When using WPT) is scoring FCP as green at 2.2 sec. Lighthouse in PageSpeed Insights is showing “Needs Improvement at 1.7” sec.
Joe Hoyle
Jun 24, 2020, 4:36:51 AM6/24/20
to chrome-ux-report, Joe Hoyle, Brendan Kenny
Hi Rick
I wondered if there had been any progress on this issue. I think that having different targets for FCP across Lighthouse and PageSpeed Insights is a significant problem and likely to cause a lot of confusion.
Kind regards.
Rick Viscomi
Jun 26, 2020, 1:34:48 PM6/26/20
to chrome-ux-report, joe....@mavens.co.uk, bck...@google.com
Hi Joe,
No progress to report just yet, but the right people are aware of this issue.
Thank you for staying on top of it.
Rick

Mohit Maini
Jul 23, 2020, 9:07:36 AM7/23/20
to chrome-ux-report, Rick Viscomi
Hi Rick
I was looking at the CrUx report dashboard and suddenly realize, when we select the Device from the filter to Mobile or Desktop only, then p75 value doesn't update accordingly. It shows for All Devices only.
It becomes relevant to know beforehand which device type has above the threshold p75 value, so that it can be prioritized accordingly. Is this update possible?
Thanks & Regards
Rick Viscomi
Jul 27, 2020, 3:09:20 PM7/27/20
to chrome-ux-report, rvis...@google.com
Hi Mohit,
(This query processes under 100 MB.)
That's correct, this is a known limitation in the CrUX Dashboard. If you want to drill down into device-specific p75 values I'd suggest querying the dataset on BigQuery. For example:
SELECT device, p75_lcp, p75_fid, p75_clsFROM `chrome-ux-report.materialized.device_summary`WHERE date = '2020-06-01' AND origin = 'https://web.dev'(This query processes under 100 MB.)
Hope that helps.
Rick
Mohit Maini
Sep 5, 2020, 5:22:50 AM9/5/20
to Rick Viscomi, chrome-ux-report
Hi Rick
--

When checking Web Vital Scores in PSI and then through CrUx API explorer, for any given URL, which one gives the most recent data.
Please answer even if it they are few hours apart.
--
You received this message because you are subscribed to the Google Groups "chrome-ux-report" group.
To unsubscribe from this group and stop receiving emails from it, send an email to chrome-ux-report+unsubscribe@chromium.org.
To view this discussion on the web visit https://groups.google.com/a/chromium.org/d/msgid/chrome-ux-report/607ace05-a1ac-4798-826d-88e8989a7779o%40chromium.org.
--
SAAS | ENTERPRISE | MARKETPLACE
| Mohit Maini |


Rick Viscomi
Sep 8, 2020, 10:36:04 AM9/8/20
to Chrome UX Report (Discussions), rvis...@google.com
Hi Mohit,
Rick
The data sources for the PSI and CrUX APIs are not updated at specific times, but rather as soon as the daily aggregations are ready, which could fluctuate day-to-day. So there is no definitive answer to which API is updated first.
Rick
On Saturday, September 5, 2020 at 5:22:50 AM UTC-4, Mohit Maini wrote:
Hi Rick
Reply all
Reply to author
Forward
0 new messages