Yeti nterruption post-mortem

rick r
Overview
On April 30th, 2018 at 08:59 PM UTC all Yeti logs started returning intermittent 200 success and 5XX errors responses on all API calls due to high latency on 2 of its 3 database nodes. The errors continued until the issue was resolved on May 1stth, 2018 at 05:13 AM UTC.
Background
The Yeti logs sign new Merkle tree heads once an hour on the hour. During the signing process, all pending entries are collected since the last tree signing and up until 30 minutes before the current time (the signing guard window). These pending entries are then sequenced, a new tree head is signed, assigned a publish time, and saved into the database.
Each Yeti log has several dedicated backend and frontend servers. The backend servers are only used for tree signing while the frontend servers handle all API calls. Since several of the API calls are returned from memory, each tree head (and its version of the Merkle tree) is assigned a date/time it will be published in order to synchronize the frontend servers. This eliminates the need for each frontend server requiring information about the other servers or by requiring some type of master coordinator for rolling forward versions of the tree. The publish date/time of each new tree head is determined at the time of signing and is based on the previously signed tree head with a fixed duration. The published date/time is set in the future to allow time for the frontend servers to read it from the database.
On average (with little variance) all new pending entries are merged into the Merkle tree within 30 minutes to 1.5 hours of submission and published within 13.5 hours after submission. In normal operation, we have a 12-hour sliding window of 12 active tree heads where each tree head is valid for 1 hour. This means new tree heads are typically set to a time 12 hours after the signing time since the frontend servers usually have 11 previously signed tree heads stacked up ready to be delivered.
Impact
Database timeouts due to the latency issue caused troubles for both tree signing and the API endpoints. Yeti2018 saw the largest impact for signing new tree heads due to a larger load of initial pending entries. The first tree head that needed to be signed at the start of the service interruption took 13.5 hours before it was able to get a valid response from the database. After the first tree head was signed it varied between 30 minutes and 4 hours to sign subsequent tree heads until the interruption was resolved. The other Yeti logs saw similar ranges with 4.7 hours being the maximum time to sign the tree head. After looking at each entry and tree head, the maximum duration to merge any entry into the Merkle tree was 13.5 hours, well within the MMD of 24 hours.
Another consequence of the longer signing times is the backlog of ready to publish tree heads was less than 12. In order to get back up to 12 tree heads (which is about 12 hours’ worth of valid tree heads), the backend signing service quickly created tree heads until the backfill was full which caused some tree heads to be signed much closer together than the normal one-hour cycle.
While some endpoints are mostly fulfilled by tree heads held in memory such as get-sth, others require database access such as add-[pre-]chain and get-entries. These endpoints saw the largest impact with a percentage of them still succeeding throughout the interruption window.
Root Cause
We use a 3-node Cassandra cluster as our database for the Yeti CT logs running on AWS. For a database query to succeed, two of the three nodes must agree for all queries. At the start of the interruption, two of the three nodes started experiencing higher latencies when reading or writing to the disk volumes which caused database timeouts and prevented the Cassandra driver from reaching a quorum. After several failed attempts to increase the I/O bandwidth on the mounted drives, the database nodes were updated to a larger AWS instance type which immediately solved the latency issues.
The underlying root cause of the I/O issue was increased latencies of the EBS block storage. During testing, the same AWS instance type was put under a much higher and constant load for a longer time period than what we have seen in production with no issues.
The other issue that hindered a quick response and caused a much longer interruption was a misconfiguration of the monitoring and alerting mechanisms which did not send out proper notifications. That alerting has been corrected and additional monitoring tools have been more finely tuned to detect these types of issues sooner.
Conclusion
While there was a large impact on the ability of the log servers to serve successful requests, the few submission requests that did succeed were successfully added to the Merkle tree well within the MMD.
Tree Head Details
Attached is a spreadsheet with details on each tree head that was signed during the interruption. The details included are (add dates are UTC):
· tree_head_id: the unique id for each tree head
· sign_time: the time the tree head was signed
· pending_entry_start_time: the start submission time (inclusive) of pending entries included in the tree head
· pending_entry_end_time: the start submission time (exclusive) of pending entries included in the tree head
· publish_start_time: the start time (inclusive) the tree head will be published
· publish_end_time: the end time (exclusive) when the tree head can no longer be published
· new_entry_publish_delay: the maximum time in hours between an entry in the tree head and when it will be first published
· new_entry_merge_delay: the maximum time in hours an entry took to be merged in the Merkle tree
· entries_added: the number of entries added to the tree head, this is the number of pending entries between pending_entry_start_time and pending_entry_end_time
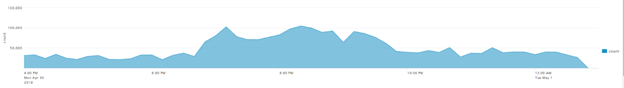
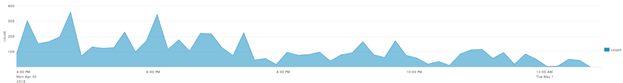
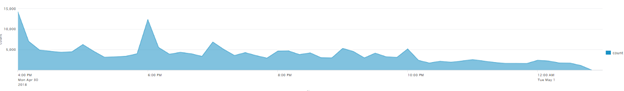
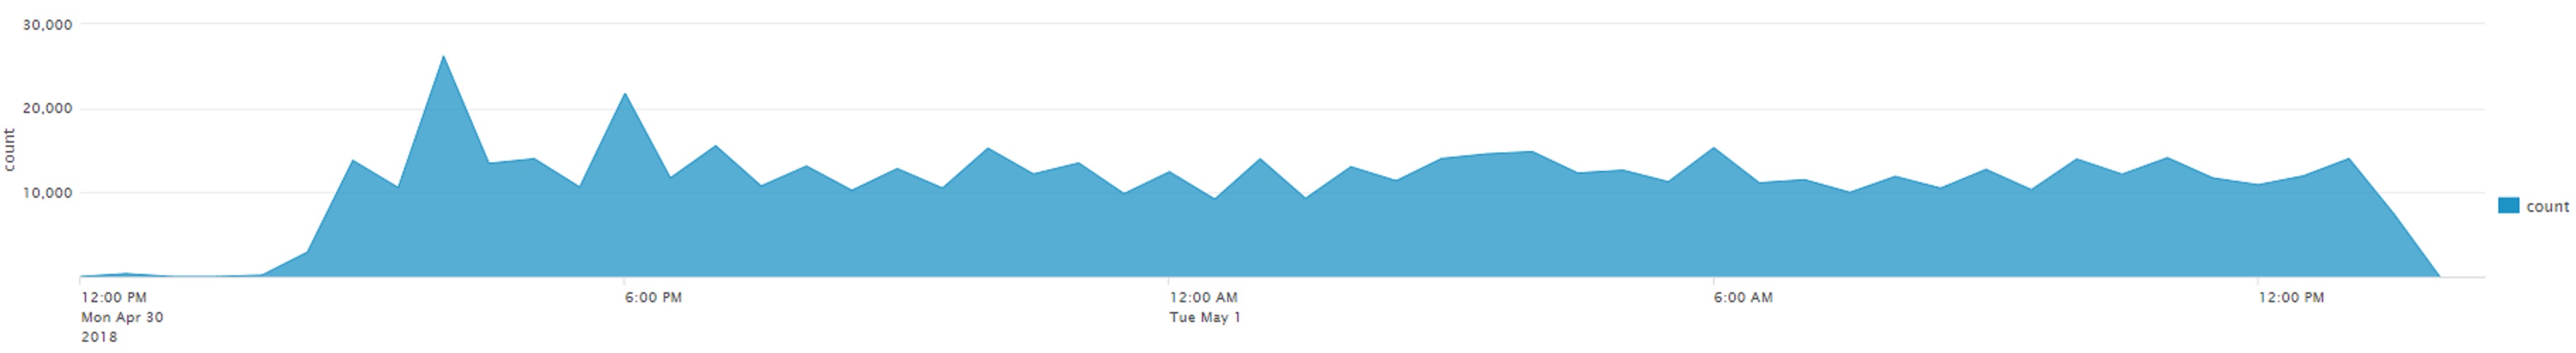
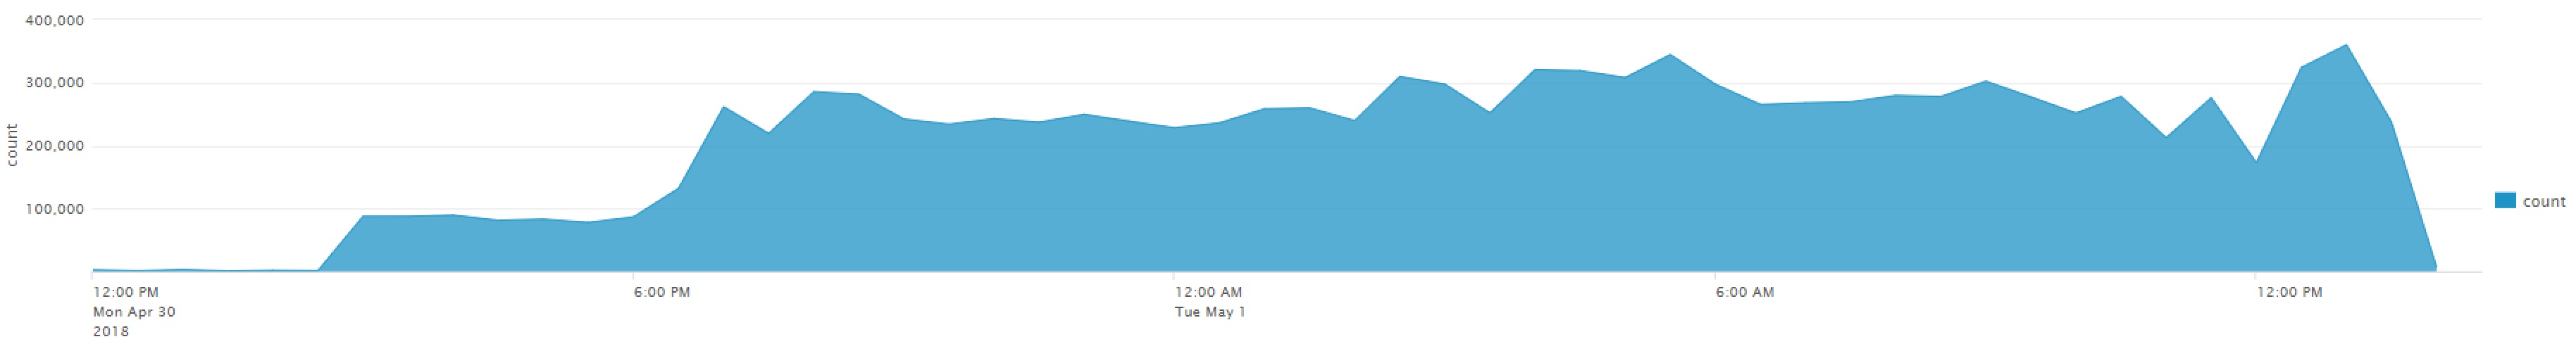
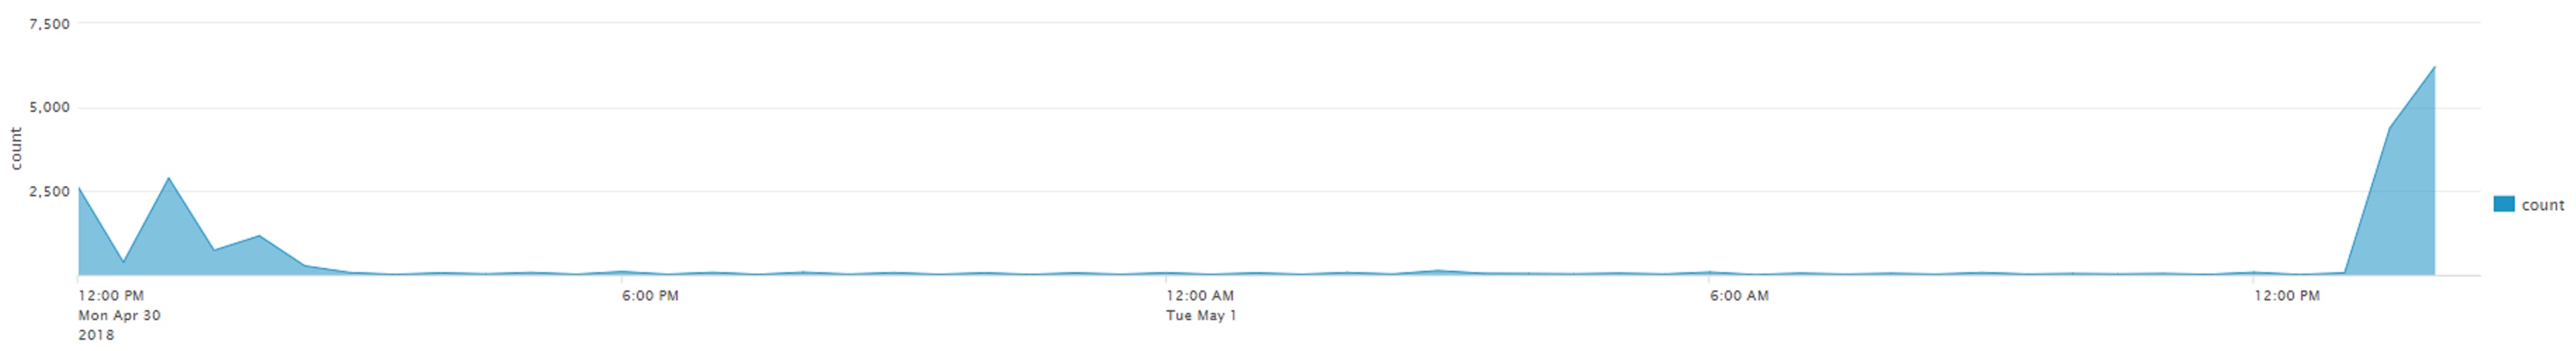
API call graphs (dates in Mountain Time)
Low get-entries successes:

High get-entries failures:
Low add-chain and add-pre-chain successes:
High add-chain and add-pre-chain failures:

Ryan Hurst

Kat Joyce
--
You received this message because you are subscribed to the Google Groups "Certificate Transparency Policy" group.
To unsubscribe from this group and stop receiving emails from it, send an email to ct-policy+...@chromium.org.
To post to this group, send email to ct-p...@chromium.org.
To view this discussion on the web visit https://groups.google.com/a/chromium.org/d/msgid/ct-policy/CACrB8x%3D4Eju_AwftuFf3aTeKXtJE_1%3DF4Pw20%2Buo6ycsAuRPHw%40mail.gmail.com.
rick r
· 2018-04-30 20:59 – a large spike in get-entries calls start to hit the system
· 2018-04-30 21:00 – get-entries and add-[pre-]chain calls start seeing failures
· 2018-05-01 21:01 – alerts fail to trigger properly
· 2018-05-01 18:40 – AWS EBS block storage I/O bandwidth is increased
· 2018-05-01 19:39 – the first database node is updated to a larger instance type
· 2018-05-01 19:46 – add-[pre-]chain calls stop see failures
· 2018-05-01 19:51 – get-entries calls stop seeing failures
· 2018-05-01 19:52 – tree signers no longer see failures
· 2018-05-01 20:04 – the second database node is updated to a larger instance type
· 2018-05-01 20:15 – the large spike is get-entries calls stop
To unsubscribe from this group and stop receiving emails from it, send an email to ct-policy+unsubscribe@chromium.org.
To post to this group, send email to ct-p...@chromium.org.
Ryan Hurst
To unsubscribe from this group and stop receiving emails from it, send an email to ct-policy+...@chromium.org.
To post to this group, send email to ct-p...@chromium.org.
Ryan Hurst
To unsubscribe from this group and stop receiving emails from it, send an email to ct-policy+unsubscribe@chromium.org.
To post to this group, send email to ct-p...@chromium.org.
To view this discussion on the web visit https://groups.google.com/a/chromium.org/d/msgid/ct-policy/0ac44a2c-122d-4613-a8ba-0d12cf832de1%40chromium.org.
