current status of bisecting regressions in frame_times
47 views
Skip to first unread message

Hitoshi Yoshida
Jul 30, 2015, 4:52:04 AM7/30/15
to Kentaro Hara, oilpan-...@chromium.org
I watched if frame_times metrics for balls_css_transition_{2,40,all}_properties.html
regress >=10% between non-Oilpan and Oilpan.
Staring with May 11 - July 9, the range became almost half a week.
Now I know..
Used revision of Blink was specified in DEPS in each revision of chromium.
thanks,
--

Kentaro Hara
Jul 30, 2015, 5:02:10 AM7/30/15
to Hitoshi Yoshida, oilpan-...@chromium.org
Thanks for the bisecting!
The only suspicious change in the blame range is http://src.chromium.org/viewvc/blink?revision=198316&view=revision. This CL enables an idle GC on non-oilpan. Would it be possible to check if the CL is the culprit of the regression?
I watched if frame_times metrics for balls_css_transition_{2,40,all}_properties.html
regress >=10% between non-Oilpan and Oilpan.
Staring with May 11 - July 9, the range became almost half a week.
Now I know..
- July 3 23:21:04 commit 857d255f700e69c80c46e7213c3b0063f9ce48b0 is good
- July 7 23:43:42 commit 441ec9912e6b1fba1eef37bebee92c224dd825d5 is bad
Does this mean that non-oilpan and oilpan were the same performance in July 3, but non-oilpan was >10% faster than oilpan in July 7?
If that is the case, does it mean that enabling the idle GC improved performance of non-oilpan by 10%? Hmm, it sounds strange since core/animations are not yet enabled on non-oilpan...
--
Kentaro Hara, Tokyo, Japan
Kentaro Hara
Jul 30, 2015, 5:04:01 AM7/30/15
to Hitoshi Yoshida, oilpan-...@chromium.org
Just to be clear:
a) oilpan at a given revision
b) non-oilpan at a given revision
c) non-oilpan at a given revision + core/animations/
Are you comparing a) with b)? Or a) with c)?
Hitoshi Yoshida
Jul 30, 2015, 5:08:58 AM7/30/15
to Kentaro Hara, oilpan-...@chromium.org
I compared a) and b).
to be more confirmed, enabled rebooting browser on every page loading, but did not manage idle GC nor lazy sweeping.
Hitoshi Yoshida
Jul 30, 2015, 5:14:27 AM7/30/15
to Kentaro Hara, oilpan-...@chromium.org
2015-07-30 18:01 GMT+09:00 Kentaro Hara <har...@chromium.org>:
Thanks for the bisecting!The only suspicious change in the blame range is http://src.chromium.org/viewvc/blink?revision=198316&view=revision. This CL enables an idle GC on non-oilpan. Would it be possible to check if the CL is the culprit of the regression?
will do.
Does this mean that non-oilpan and oilpan were the same performance in July 3, but non-oilpan was >10% faster than oilpan in July 7?If that is the case, does it mean that enabling the idle GC improved performance of non-oilpan by 10%? Hmm, it sounds strange since core/animations are not yet enabled on non-oilpan...
I think it is wrong.
The metrics seem to regress on Oilpan build, not improve non-Oilpan build.
And in "no regression" revisions, we seem to have had small regressions.
----
Kentaro Hara
Jul 30, 2015, 5:26:44 AM7/30/15
to Hitoshi Yoshida, oilpan-...@chromium.org
Then my guess that http://src.chromium.org/viewvc/blink?revision=198316&view=revision is the culprit may be wrong. The CL just enables an idle GC on non-oilpan, so it shouldn't change performance of oilpan.
Hitoshi Yoshida
Jul 30, 2015, 5:32:02 AM7/30/15
to Kentaro Hara, oilpan-...@chromium.org
Hmm, let me continue working for this.
It may be good to plot values...
Kentaro Hara
Jul 30, 2015, 5:33:53 AM7/30/15
to Hitoshi Yoshida, oilpan-...@chromium.org
Hmm, let me continue working for this.
It may be good to plot values...
Thanks, that is really helpful. It's not easy to find any other suspicious CL in the range...
Blink's blame range is here:
Hitoshi Yoshida
Jul 31, 2015, 4:25:06 AM7/31/15
to Kentaro Hara, oilpan-...@chromium.org
I find that we can check those regressions with perf dashboard.
(because the regressions happen also in Oilpan build.)
Test suite: smoothness.tough_animation_cases
Bot: linux-release,linux-oilpan-release
Subtest: frame_times
Subtest: balls_css_transition_{2,40,all}_properties.html (it'd be good to click [ADD] with each page)
Looking them, following Blink blame range reduces frame_times on non-Oilpan builds, while it does not change on Oilpan build.
Hitoshi Yoshida
Jul 31, 2015, 4:37:03 AM7/31/15
to Kentaro Hara, oilpan-...@chromium.org
JFYI, Chromium Commit position range is
https://chromium.googlesource.com/chromium/src/+log/c89cfe476f4d1f9bae23e6980a12a379fbd00da4%5E..86efa5cd35a94289ba8af2ae243b2cdbd3f738ef?pretty=fuller
and its date range is 2015-06-24T22:44:55 - 2015-06-25T18:22:38
Kentaro Hara
Jul 31, 2015, 4:40:48 AM7/31/15
to Hitoshi Yoshida, oilpan-...@chromium.org
Looking them, following Blink blame range reduces frame_times on non-Oilpan builds, while it does not change on Oilpan build.
http://build.chromium.org/f/chromium/perf/dashboard/ui/changelog_blink.html?url=/trunk&mode=html&range=197759:197820
Yeah, I cannot find any suspicious CL...
JFYI, Chromium Commit position range is
https://chromium.googlesource.com/chromium/src/+log/c89cfe476f4d1f9bae23e6980a12a379fbd00da4%5E..86efa5cd35a94289ba8af2ae243b2cdbd3f738ef?pretty=fuller
It is possible that one of the V8 rolls changed some GC conditions and caused the regression, but not sure.
Sorry for taking your time, but would you continue running the bisecting to find the culprit CL?
Hitoshi Yoshida
Jul 31, 2015, 4:46:16 AM7/31/15
to Kentaro Hara, oilpan-...@chromium.org
I will continue the bisecting, but if your suggestion is correct, I mean, outside of Chrome or Blink is the reason,
it may be difficult for us to specify a CL....
Kentaro Hara
Jul 31, 2015, 4:48:49 AM7/31/15
to Hitoshi Yoshida, oilpan-...@chromium.org
Once we specify that the V8 roll is the culprit, we can ask the V8 team to take a look :)
Kentaro Hara
Aug 4, 2015, 8:13:43 PM8/4/15
to Hitoshi Yoshida, oilpan-...@chromium.org
Let's make a progress here.
As far as I tested in my local Linux, there is no regression in the frame_times metric balls_css_transition_{2,40,all}_properties.html between non-oilpan and oilpan.
1) keishi-san, would you confirm that there is no regression in your local Linux?
(Assuming that there is no regression, keep reading.)
2) peria-san, would you update the CL so that we can apply the CL with ToT?
3) Let's measure the performance on haraken or/and keishi-san's machine(s).
Hitoshi Yoshida
Aug 5, 2015, 12:04:46 AM8/5/15
to Kentaro Hara, oilpan-...@chromium.org
Updated the patch. PS34 is applicable on tot.
Hitoshi Yoshida
Aug 5, 2015, 1:32:22 AM8/5/15
to Kentaro Hara, oilpan-...@chromium.org
and I measured it again just to confirm.
on my machine, it scores
~52ms with non-Oilpan build (w/o the patch)
~60ms with non-Oilpan build (w/ the patch) and Oilpan build (w/o the patch)
for balls_css_transition_{2,all}_properties.html.
Cannot run balls_css_transition_40_properties.html, because of crashes in all cases.

Keishi Hattori
Aug 5, 2015, 1:35:33 AM8/5/15
to Kentaro Hara, Hitoshi Yoshida, oilpan-...@chromium.org
Here is the results I got.
https://257e68df4dae930120a4c67b6f7a507d5042fbc3.googledrive.com/host/0B4aiM9jljUy8UEh0QjR3SUVXaVE/balls-css-vanilla-vs-oilpan.htmlI just talked with peria@ and the values are similar to his results.
Is this very different from haraken@'s results?
--
- Keishi
Hitoshi Yoshida
Aug 5, 2015, 1:41:30 AM8/5/15
to Keishi Hattori, Kentaro Hara, oilpan-...@chromium.org
JFYI
keishi@ told me that we could run all tests without crashes if we specified each case with --page-filter option.
$ ./tools/perf/run_benchmark run smoothness.tough_animation_cases --story-filter="balls_css_transition_40_properties.html"
thanks,
Keishi Hattori
Aug 5, 2015, 1:55:19 AM8/5/15
to Hitoshi Yoshida, Kentaro Hara, oilpan-...@chromium.org
peria-san,
Here are the scripts I use to merge results.html files.
Usage:
`concat_results` extractes json from results.html and simply concatenates them.
`rename_all_results` changes all the labels of the data in a json file.
`merge_results` merges data with the same label.
`json_to_html` embeds the json into results.html. Use `-t` to specify the template html.
All commands output to stdout by default but can out put to file using `-o`.
Example usage:
I put all the results.html from telemetry in a direcotry. Like vanilla/1/balls_css_transition_2_properties/results.html.
First I create json file containing all data for a particular label.
$ concat_results vanilla/**/*.html | rename_all_results vanilla | merge_results -o vanilla.json
$ concat_results oilpan/**/*.html | rename_all_results oilpan | merge_results -o oilpan.json
Then I merge the ones I want.
$ concat_results vanilla.json oilpan.json | json_to_html -t vanilla/1/blink_perf.canvas/results.html -o vanilla-vs-oilpan.html
The same scripts can be used to compare as many results as
$ concat_results vanilla/**/*.html | rename_all_results vanilla | merge_results -o vanilla.json
$ concat_results oilpan/**/*.html | rename_all_results oilpan | merge_results -o oilpan.json
$ concat_results patched/**/*.html | rename_all_results patched | merge_results -o patched.json
$ concat_results vanilla.json oilpan.json patched.json | json_to_html -t vanilla/1/blink_perf.canvas/results.html -o vanilla-vs-oilpan.html
--
- Keishi
Kentaro Hara
Aug 5, 2015, 1:55:57 AM8/5/15
to Hitoshi Yoshida, Keishi Hattori, oilpan-...@chromium.org
Thanks for digging!
Hmm, I cannot still reproduce the regression in my local Linux. I confirmed that the oilpan build is really enabling oilpan though...
Let me talk offline.
On Wed, Aug 5, 2015 at 2:41 PM, Hitoshi Yoshida <pe...@chromium.org> wrote:
Hitoshi Yoshida
Aug 5, 2015, 1:57:50 AM8/5/15
to Keishi Hattori, Kentaro Hara, oilpan-...@chromium.org
Thank you for sharing the tool!!
Kentaro Hara
Aug 5, 2015, 3:59:12 AM8/5/15
to Hitoshi Yoshida, Keishi Hattori, oilpan-...@chromium.org
I confirmed that the regression reproduces in my Linux box on both content_shell and chrome. (It was hard to identify the regression because my results were biased by one strangely big frame_times value sometimes observed at the first frame.)
Sorry about the noise!
So... the regression is really there.
Kentaro Hara
Aug 5, 2015, 4:05:28 AM8/5/15
to Hitoshi Yoshida, Keishi Hattori, oilpan-...@chromium.org
keishi-san: Sorry again, but would you mind comparing master vs. oilpan (without peria-san's CL) in Mac?
The Chromium perf dashboard is saying that there is a regression in the following range:
However, I'm skeptical about it because the regression is observed only in the linux-release bot.
If we cannot reproduce the regression on Mac, the perf dashboard may be correct and we should look at the range more in details (as far as I scan, I cannot find any suspicious CL in the range). If we can reproduce the regression on Mac, we can say with confidence that the perf dashboard is wrong and we need to look at other ranges.
I'll also try to bisect it in my local Linux box.
Keishi Hattori
Aug 5, 2015, 8:23:02 AM8/5/15
to Kentaro Hara, Hitoshi Yoshida, oilpan-...@chromium.org
Looks like no regression. I've reviewed my zsh history and checked that I am using the proper binaries.
https://257e68df4dae930120a4c67b6f7a507d5042fbc3.googledrive.com/host/0B4aiM9jljUy8UEh0QjR3SUVXaVE/mac-balls-css-vanilla-vs-oilpan.html--
- Keishi
Keishi Hattori
Aug 5, 2015, 9:00:42 AM8/5/15
to Kentaro Hara, Hitoshi Yoshida, oilpan-...@chromium.org
The old one merged results from 20 runs.
I separated out each run to get a closer look at the pattern.
https://257e68df4dae930120a4c67b6f7a507d5042fbc3.googledrive.com/host/0B4aiM9jljUy8UEh0QjR3SUVXaVE/balls-css-individual-runs.htmlThe periodic spikes going down look very similar to the results peria@ showed me today.
Oilpan looks like it always has an upward spike at about three quarters into the test, and that seems to be the only bad part.
Possibly a GC creating jank?
--
- Keishi
Kentaro Hara
Aug 5, 2015, 10:27:40 AM8/5/15
to Keishi Hattori, Hitoshi Yoshida, oilpan-...@chromium.org
Thanks, we're getting close.
On Wed, Aug 5, 2015 at 10:00 PM, Keishi Hattori <kei...@google.com> wrote:
The old one merged results from 20 runs.I separated out each run to get a closer look at the pattern.https://257e68df4dae930120a4c67b6f7a507d5042fbc3.googledrive.com/host/0B4aiM9jljUy8UEh0QjR3SUVXaVE/balls-css-individual-runs.htmlThe periodic spikes going down look very similar to the results peria@ showed me today.Oilpan looks like it always has an upward spike at about three quarters into the test, and that seems to be the only bad part.Possibly a GC creating jank?
Possibly. Can you get a trace for that?
Also can you observe the spike in Mac too? (i.e., It is possible that the spike exists in Mac as well but it doesn't result in a regression for some reason.)
(FYI, I bisected the regression in my local Linux box and confirmed that the regression has been consistently happening since Mar 10. However, the regression pattern observed in my Linux is pretty much different from keishi-san's one and peria-san's one. So I think it's better to debug it in keishi-san's machine or peria-san's machine.)
Keishi Hattori
Aug 5, 2015, 11:40:47 PM8/5/15
to Kentaro Hara, Hitoshi Yoshida, oilpan-...@chromium.org
Sorry I took a trace of mac-vanilla and realized I probably screwed up and used the oilpan binary by mistake. I am retaking the data.
I am attaching the oilpan traces from mac and linux.
Looks like there is a conservative GC at the 3/4 position on both Mac and Linux. No other GCs during the test except the beginning and end.
Here is the closeup look at the results from mac (like I said do not trust vanilla results)
https://257e68df4dae930120a4c67b6f7a507d5042fbc3.googledrive.com/host/0B4aiM9jljUy8UEh0QjR3SUVXaVE/mac-balls-css-individual-runs.htmlThere is a peak at the GC position but there are other peaks with similar heights as well.
--
- Keishi
Keishi Hattori
Aug 6, 2015, 1:02:02 AM8/6/15
to Kentaro Hara, Hitoshi Yoshida, oilpan-...@chromium.org
Here is the data on mac with the correct vanilla binary.
Looks like there is around 48ms→51ms (-6%) regressions.
Close up
https://257e68df4dae930120a4c67b6f7a507d5042fbc3.googledrive.com/host/0B4aiM9jljUy8UEh0QjR3SUVXaVE/new-mac-balls-css-individual-runs.htmlFYI The regression on Linux was around 51ms-60ms (-16%).
--
- Keishi
Kentaro Hara
Aug 6, 2015, 1:34:37 AM8/6/15
to Keishi Hattori, Hitoshi Yoshida, oilpan-...@chromium.org
Thanks, I'm trying to write a CL that replaces the conservative GC that is causing the spike with a precise GC (before the conservative GC is scheduled). However, I'm not yet successful at making it workable :) Give me a bit more time.
dstockwell@ is visiting Tokyo this week, so maybe we can directly talk with him about the problem and get some feedback.
Keishi Hattori
Aug 10, 2015, 8:51:09 AM8/10/15
to Kentaro Hara, Hitoshi Yoshida, oilpan-...@chromium.org
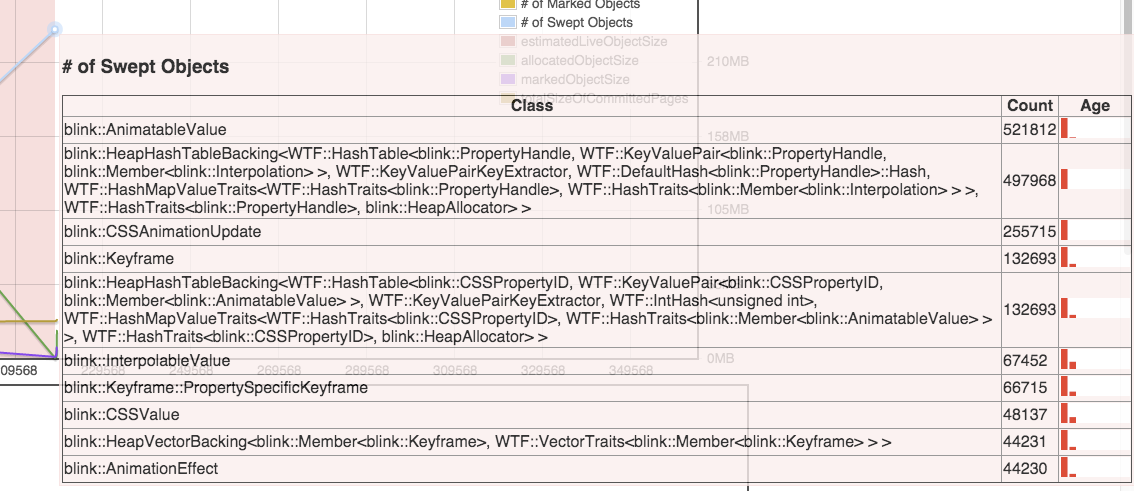
Here is the heap visualizer for balls_css_transition_all_properties.html.
https://fc22316f052326f6d9de9a282a6039e811d12e8d-www.googledrive.com/host/0B4aiM9jljUy8MVhiQ2JaQndKZTQ/#2015-08-balls_css_transition_all_properties_html.zipThe page load was very long because of the profiler overhead (so much so that I had to increase the timeout). The actual test is in the right half of the chart.
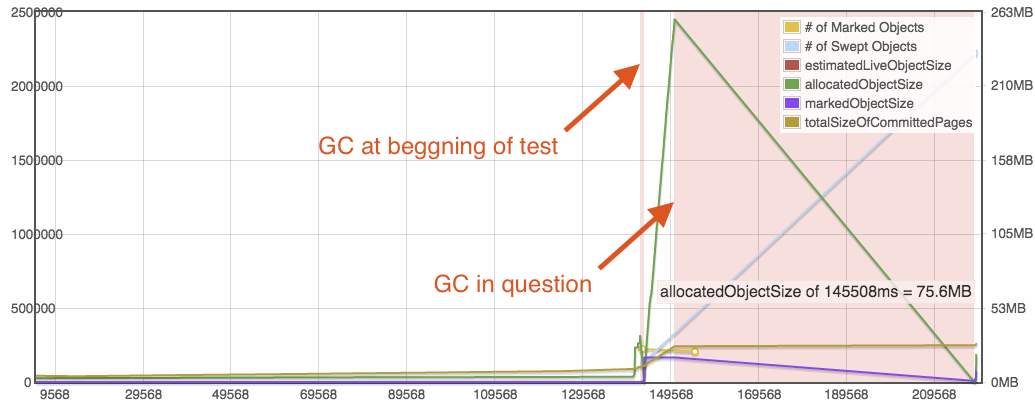
These seems to be the swept objects.
--
- Keishi
Kentaro Hara
Aug 10, 2015, 10:31:11 AM8/10/15
to Keishi Hattori, Hitoshi Yoshida, oilpan-...@chromium.org
Thanks for the result -- this is really useful!
Would you mind taking the heap profiling with https://codereview.chromium.org/1276183004/ applied? That CL moved AnimatableValue, those HeapHashMaps, Keyframe, InterpolableValue and PropertySpecificKeyframe out of the heap. I'm curious what objects are still remaining in the heap.
Keishi Hattori
Aug 11, 2015, 12:23:44 AM8/11/15
to Kentaro Hara, Hitoshi Yoshida, oilpan-...@chromium.org
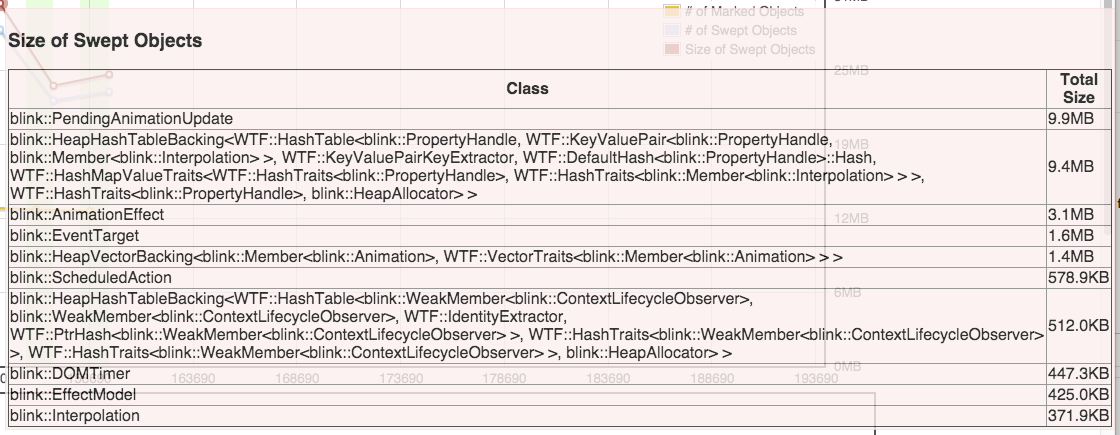
Results with the unship CL.
https://fc22316f052326f6d9de9a282a6039e811d12e8d-www.googledrive.com/host/0B4aiM9jljUy8MVhiQ2JaQndKZTQ/#2015-08-unship-balls_css_transition_all_properties_html.zip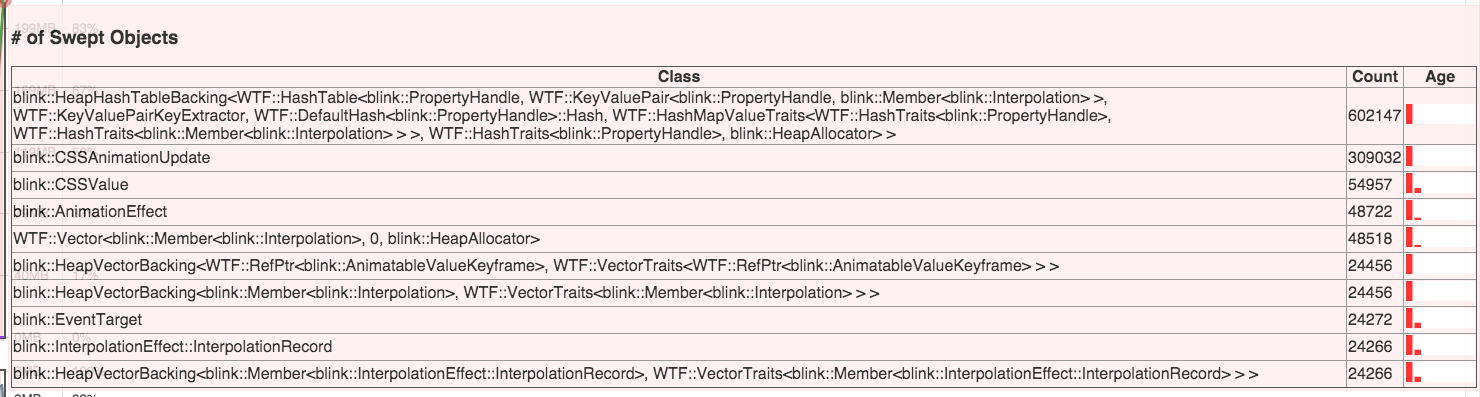
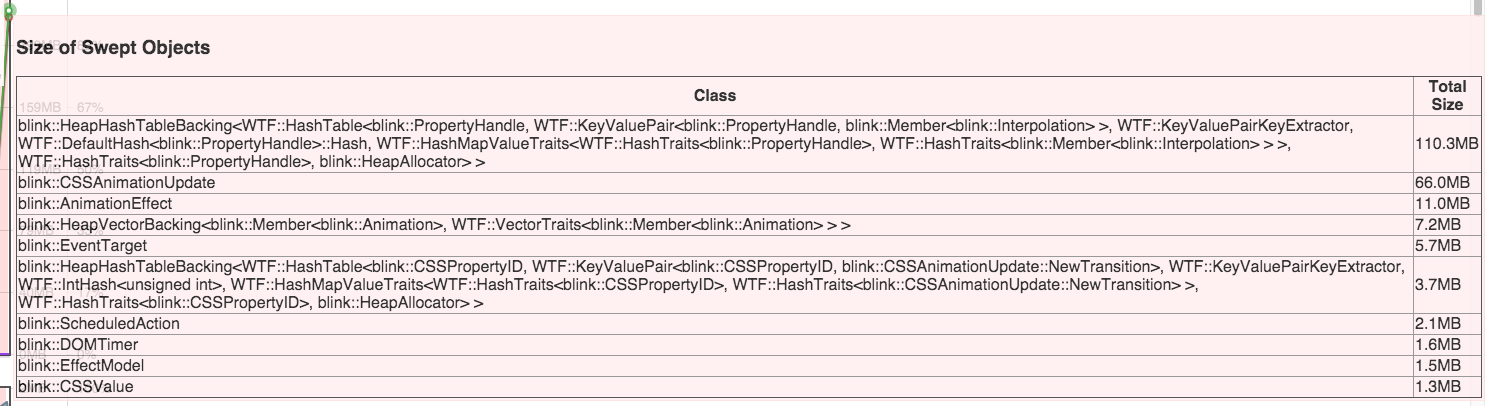
I also added the ability to output the total payload size of swept objects.
Here is the result for vanilla
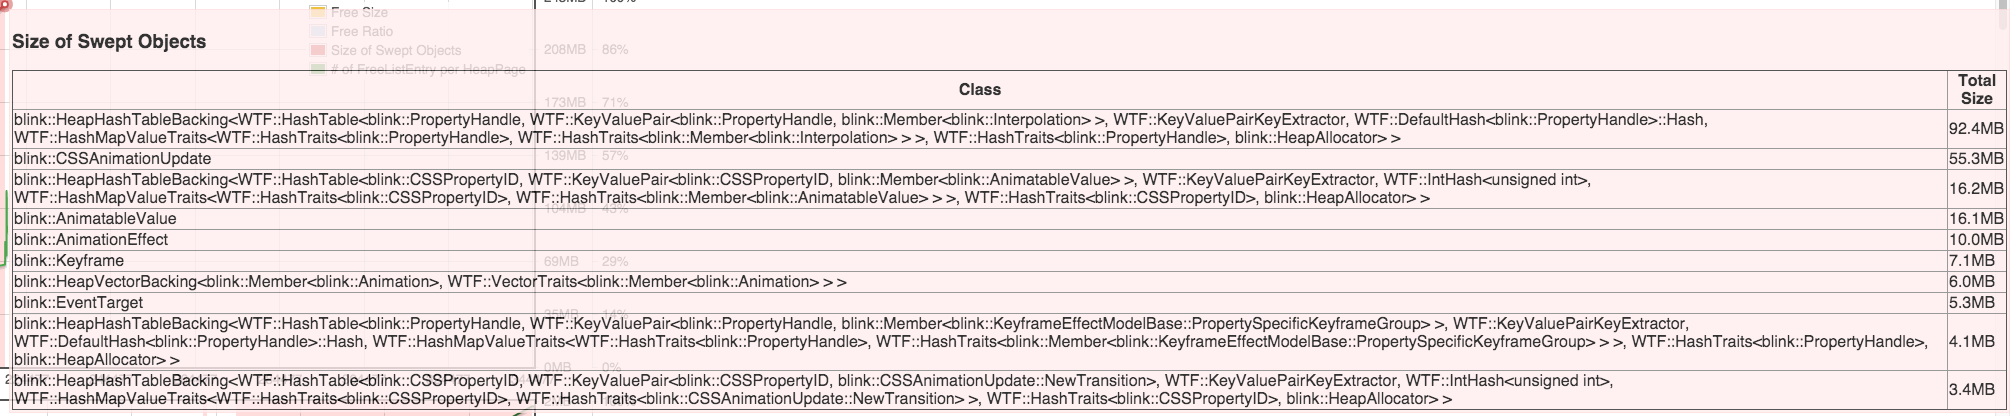
Here is the result for ToT with unship CL.
--
- Keishi
Kentaro Hara
Aug 11, 2015, 3:12:38 AM8/11/15
to Keishi Hattori, Hitoshi Yoshida, oilpan-...@chromium.org
Thanks keishi-san!!
Thanks to the profiling data, I managed to dramatically reduce the number of dead objects. The huge HashMap and the CSSAnimationUpdate are now gone in my local builds :)
Let me experiment a bit more.
Kentaro Hara
Aug 11, 2015, 4:22:56 AM8/11/15
to Keishi Hattori, Hitoshi Yoshida, oilpan-...@chromium.org
My conclusion is the following two CLs:
a) Unshipping AnimatableValues etc: https://codereview.chromium.org/1276183004/
b) Optimize GC heuristics: https://codereview.chromium.org/1272083003/
As far as I experiment in my local builds, the frame_times & queueing_durations regressions are gone if we apply a) and b).
keishi-san: Would you measure tough_animation_cases.css_properties_* for the following builds?
- ToT without oilpan.
- ToT with oilpan.
- ToT + a) with oilpan.
- ToT + a) + b) with oilpan.
Keishi Hattori
Aug 12, 2015, 1:58:44 AM8/12/15
to Kentaro Hara, Hitoshi Yoshida, oilpan-...@chromium.org
This is strange. I am not seeing any improvement at all. I should check my binaries.
https://257e68df4dae930120a4c67b6f7a507d5042fbc3.googledrive.com/host/0B4aiM9jljUy8UEh0QjR3SUVXaVE/vanilla-vs-oilpan-vs-ani-a-vs-ani-ab.html--
- Keishi
Kentaro Hara
Aug 12, 2015, 3:40:10 AM8/12/15
to Keishi Hattori, Hitoshi Yoshida, oilpan-...@chromium.org
Thanks for the result!
Given that my local Linux box is flaky, it's possible that the CLs don't completely fix the regressions. Maybe can you take a heap snapshot for ToT + a) + b) + oilpan and confirm that the combination dramatically reduces the object count?
Keishi Hattori
Aug 12, 2015, 4:18:59 AM8/12/15
to Kentaro Hara, Hitoshi Yoshida, oilpan-...@chromium.org
I did some ordinary traces and confirmed that the result is using the correct binaries.
Looks like the frame time spikes are gone (collectGarbage wall time is half), but I guess the frame time average overall hasn't improved.
--
- Keishi
Keishi Hattori
Aug 12, 2015, 8:14:50 AM8/12/15
to Kentaro Hara, Hitoshi Yoshida, oilpan-...@chromium.org
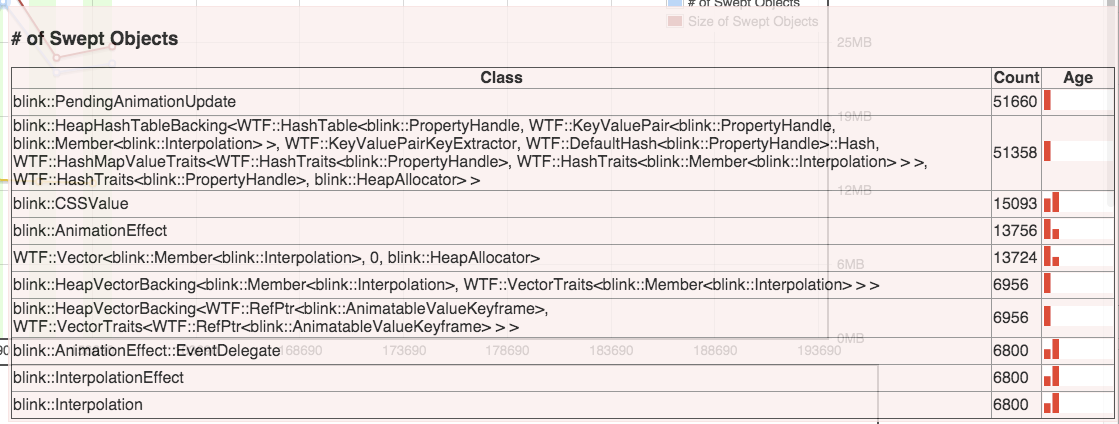
Here is the heap visualizer result for ToT + a) + b) + oilpan
Peak swept object count ~2,200,000 -> ~250,000 (88% reduction)
Peak marked object count ~200,000 -> ~100,000 (50% reduction)
--
- Keishi
Kentaro Hara
Aug 12, 2015, 8:35:24 AM8/12/15
to Keishi Hattori, Hitoshi Yoshida, oilpan-...@chromium.org
On Wed, Aug 12, 2015 at 9:14 PM, Keishi Hattori <kei...@google.com> wrote:
Here is the heap visualizer result for ToT + a) + b) + oilpanPeak swept object count ~2,200,000 -> ~250,000 (88% reduction)Peak marked object count ~200,000 -> ~100,000 (50% reduction)
Thanks for the data!
It seems strange that the miracle reduction doesn't improve the performance. Let me chat offline tomorrow :)
Keishi Hattori
Aug 12, 2015, 11:37:11 PM8/12/15
to Kentaro Hara, Hitoshi Yoshida, oilpan-...@chromium.org
Comparing ToT+oilpan vs ToT + a) + b) + oilpan.
The tracing data shows that the collectGarbage time has gone down from 17ms to 8ms and this matches the 50% reduction in marked object count.
The tracing data shows that the collectGarbage time has gone down from 17ms to 8ms and this matches the 50% reduction in marked object count.
The total time spent in collectGarbage during the test has gone up from 17ms to 40ms(5 precise GCs each taking 8ms). (I am excluding the first Conservative GC because I don't think it effects the frame_times measurement. If we include that the change is from 37ms to 45ms).
But come to think of it, the sum of frame times is like 59ms * 158frames = 9322ms so time spent in collectGarbage should be well below 1% and I don't think it explains the regression.
I'm attaching the tracing data I used for ToT + a) + b) + oilpan.
--
- Keishi
Kentaro Hara
Aug 13, 2015, 5:09:38 AM8/13/15
to Keishi Hattori, Hitoshi Yoshida, oilpan-...@chromium.org
I rebased the CLs with ToT:
a) Unshipping AnimatableValues etc: https://codereview.chromium.org/1276183004/
b) Optimize GC heuristics: https://codereview.chromium.org/1272083003/
I think a) will remove the CSSAnimationUpdates and the HashMaps (but am not 100% sure). Would you take the heap snapshot and see if the CSSAnimationUpdates and the HashMaps are gone?
Keishi Hattori
Aug 13, 2015, 7:08:57 AM8/13/15
to Kentaro Hara, Hitoshi Yoshida, oilpan-...@chromium.org
Kentaro Hara
Aug 13, 2015, 7:34:54 AM8/13/15
to Keishi Hattori, Hitoshi Yoshida, oilpan-...@chromium.org
Great! The patch set 7 of https://codereview.chromium.org/1276183004/ completely removed the HeapHashMap.
I think I can remove the PendingAnimationUpdate as well (but it's not that easy).
Kentaro Hara
Aug 13, 2015, 8:11:32 AM8/13/15
to Keishi Hattori, Hitoshi Yoshida, oilpan-...@chromium.org
The patch set 8 made the PendingAnimationUpdate DISALLOW_ALLOCATION.
I think it will dramatically reduce a pressure on our heap. Maybe we don't need to trigger GCs during the benchmark at all :)
Kentaro Hara
Aug 13, 2015, 8:22:57 AM8/13/15
to Keishi Hattori, Hitoshi Yoshida, oilpan-...@chromium.org
Given that we've reduced the memory usage of css_properties_* benchmarks enough, we won't need to worry about the GC heuristics at the moment. In other words, we won't need to worry about b).
Shall we just compare ToT with ToT + a) + oilpan?
a) Unship AnimatableValues etc: https://codereview.chromium.org/1276183004/
Keishi Hattori
Aug 14, 2015, 2:34:07 AM8/14/15
to Kentaro Hara, Hitoshi Yoshida, oilpan-...@chromium.org
ToT + oilpan
ToT + a) + oilpan
--
- Keishi
Kentaro Hara
Aug 14, 2015, 2:53:37 AM8/14/15
to Keishi Hattori, Hitoshi Yoshida, oilpan-...@chromium.org
Thanks for the result!
Is there still any regression between ToT (without oilpan) and ToT + (a) + oilpan in css_properties_*?
Kentaro Hara
Aug 14, 2015, 3:36:39 AM8/14/15
to Keishi Hattori, Hitoshi Yoshida, oilpan-...@chromium.org
FWIW, the patch set 9 of https://codereview.chromium.org/1276183004 will remove the HeapHashMap from the swept objects.
Keishi Hattori
Aug 14, 2015, 7:01:41 AM8/14/15
to Kentaro Hara, Hitoshi Yoshida, oilpan-...@chromium.org
Here is benchmark results for a) PS9.
--
- Keishi
Kentaro Hara
Aug 14, 2015, 7:05:34 AM8/14/15
to Keishi Hattori, Hitoshi Yoshida, oilpan-...@chromium.org
Thanks for the result... It is really sad that reducing the number of objects on the heap doesn't help fix the regression...
Kentaro Hara
Aug 14, 2015, 7:34:57 AM8/14/15
to Keishi Hattori, Hitoshi Yoshida, oilpan-...@chromium.org
The total time spent in collectGarbage during the test has gone up from 17ms to 40ms(5 precise GCs each taking 8ms). (I am excluding the first Conservative GC because I don't think it effects the frame_times measurement. If we include that the change is from 37ms to 45ms).
But come to think of it, the sum of frame times is like 59ms * 158frames = 9322ms so time spent in collectGarbage should be well below 1% and I don't think it explains the regression.
Yeah, all of the results we've collected so far indicate that the regression is coming from outside the GC pause times...
Kentaro Hara
Aug 14, 2015, 11:23:36 AM8/14/15
to Keishi Hattori, Hitoshi Yoshida, oilpan-...@chromium.org
(Next week I won't be able to touch my desktop and thus won't be able to investigate the core/animation regression. So let me post a couple of ideas here. It is super important to fix the regression.)
- In about:tracing, compare the frame time between ToT and ToT+(a)+oilpan. Is each frame time of ToT+(a)+oilpan larger than each frame time of ToT, even if no GC or lazy sweeping is scheduled in that frame? If that is the case, it clearly indicates that the regression is coming from outside GC overheads.
- ToT+(a)+oilpan visualizes the value of Partitions::totalSizeOfCommittedPagesKB in about:tracing with TRACE_COUNTER (See https://code.google.com/p/chromium/codesearch#chromium/src/third_party/WebKit/Source/platform/heap/Heap.cpp&q=heap.cpp&sq=package:chromium&type=cs&l=2414). Visualize the value in ToT as well. Maybe can we observe that Partitions::totalSizeOfCommittedPagesKB of ToT+(a)+oilpan is much larger than Partitions::totalSizeOfCommittedPagesKB of ToT? It would mean that some Oilpan objects are delaying destructions of some PartitionAlloc objects, which increases the working set and thus regresses the memory locality. (We had the problem in HTMLToken::m_data.)
- Add some overhead to ThreadState::persistentAllocated/persistentFreed. If it increases the regression, it indicates that the allocation/free overhead of persistent handles matters in that benchmark.
- Bisect the range that caused the regression (although I failed in finding the range). I don't think we were observing such a huge regression at the final performance report (https://docs.google.com/document/d/1_zHanQ8o1lZt1NA_X_2Uo4Tk_wXEkik5JXs8nSSu2Rs/edit).
Keishi Hattori
Aug 17, 2015, 7:58:06 AM8/17/15
to Kentaro Hara, Hitoshi Yoshida, oilpan-...@chromium.org
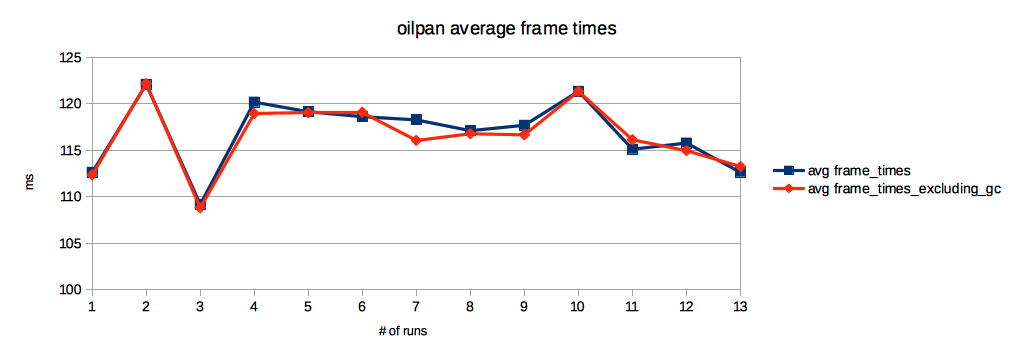
Some results I collected today.
"a9" is ToT+(a)+oilpan.
1) I've written a python script to extract frame times from trace files.
The results for oilpan and a9 seem to contradict each other so I'll collect more samples tomorrow.
| vanilla | oilpan | a9 | |
| exclude frames containing collectGarbage and lazySweep | 102.6ms | 113.7ms | 106.1ms |
| all frames | 102.6ms | 108.1ms | 110.4ms |
3) I've added overhead to ThreadState::persistentAllocated/persistentFreed and confirmed ThreadState::persistentAllocated/persistentFreed is called around 3,000,000 times per frame.
--
- Keishi
Kentaro Hara
Aug 17, 2015, 8:58:54 AM8/17/15
to Keishi Hattori, Hitoshi Yoshida, oilpan-...@chromium.org
Thanks for the result!
On Mon, Aug 17, 2015 at 8:57 PM, Keishi Hattori <kei...@google.com> wrote:
Some results I collected today."a9" is ToT+(a)+oilpan.1) I've written a python script to extract frame times from trace files.The results for oilpan and a9 seem to contradict each other so I'll collect more samples tomorrow.
vanilla oilpan a9 exclude frames containing collectGarbage and lazySweep 102.6ms 113.7ms 106.1ms all frames 102.6ms 108.1ms 110.4ms 2) I've confirmed that Partitions::totalSizeOfCommittedPagesKB is around 108MB for vanilla, oilpan and a9.3) I've added overhead to ThreadState::persistentAllocated/persistentFreed and confirmed ThreadState::persistentAllocated/persistentFreed is called around 3,000,000 times per frame.
This sounds too many...
- Can we know where the persistent handles come from? (Maybe we can just insert CRASH() and get the stack trace of the 10000-th persistent handle.)
- If we add some overhead to ThreadState::persistentAllocated/persistentFreed, can we observe a regression? If we observe it, it is very likely that the overhead of creating/destructing persistent handles is the culprit of the frame_times regression.

Sigbjorn Finne
Aug 17, 2015, 4:56:24 PM8/17/15
to Kentaro Hara, Keishi Hattori, Hitoshi Yoshida, oilpan-...@chromium.org
Den 8/17/2015 14:58, Kentaro Hara skreiv:
> Thanks for the result!
>
> On Mon, Aug 17, 2015 at 8:57 PM, Keishi Hattori <kei...@google.com
> <mailto:kei...@google.com>> wrote:
>
> Some results I collected today.
> "a9" is ToT+(a)+oilpan.
>
> 1) I've written a python script to extract frame times from trace files.
> The results for oilpan and a9 seem to contradict each other so I'll
> collect more samples tomorrow.
>
> vanilla oilpan a9
> exclude frames containing collectGarbage and lazySweep 102.6ms
> 113.7ms 106.1ms
> all frames 102.6ms 108.1ms 110.4ms
>
>
> 2) I've confirmed that Partitions::totalSizeOfCommittedPagesKB is
> around 108MB for vanilla, oilpan and a9.
> 3) I've added overhead to
> ThreadState::persistentAllocated/persistentFreed and confirmed
> ThreadState::persistentAllocated/persistentFreed is called around
> 3,000,000 times per frame.
>
>
> This sounds too many...
>
> - Can we know where the persistent handles come from? (Maybe we can just
> insert CRASH() and get the stack trace of the 10000-th persistent handle.)
>
Persistent<>s created via StyleRare(Non)InheritedData would be worth
> Thanks for the result!
>
> On Mon, Aug 17, 2015 at 8:57 PM, Keishi Hattori <kei...@google.com
> <mailto:kei...@google.com>> wrote:
>
> Some results I collected today.
> "a9" is ToT+(a)+oilpan.
>
> 1) I've written a python script to extract frame times from trace files.
> The results for oilpan and a9 seem to contradict each other so I'll
> collect more samples tomorrow.
>
> vanilla oilpan a9
> exclude frames containing collectGarbage and lazySweep 102.6ms
> 113.7ms 106.1ms
> all frames 102.6ms 108.1ms 110.4ms
>
>
> 2) I've confirmed that Partitions::totalSizeOfCommittedPagesKB is
> around 108MB for vanilla, oilpan and a9.
> 3) I've added overhead to
> ThreadState::persistentAllocated/persistentFreed and confirmed
> ThreadState::persistentAllocated/persistentFreed is called around
> 3,000,000 times per frame.
>
>
> This sounds too many...
>
> - Can we know where the persistent handles come from? (Maybe we can just
> insert CRASH() and get the stack trace of the 10000-th persistent handle.)
>
counting.
(cf.
https://groups.google.com/a/chromium.org/d/msg/oilpan-reviews/V6K7Hohfguo/zdcpXtjWCgAJ
observations.)
--sigbjorn
Kentaro Hara
Aug 20, 2015, 4:10:00 AM8/20/15
to Sigbjorn Finne, Keishi Hattori, Hitoshi Yoshida, oilpan-...@chromium.org
keishi-san: Is there any update or anything I can help?
Keishi Hattori
Aug 20, 2015, 5:19:41 AM8/20/15
to Sigbjorn Finne, Kentaro Hara, Hitoshi Yoshida, oilpan-...@chromium.org
1) The 3,000,000 per frame number was calculated by dividing the difference in frame time with the amount of sleep I added, but it turns out it was way off. I added a counter to persistentAllocated/persistentFreed and observed that the actual number of times called is around 3,000 times per frame. Around 44% of that is from StyleRareNonInheritedData.
2) By comparing the average frame times of all frames and the average frame times of frames that contain no marking or sweeping, I think we can conclude that marking and sweeping is not affecting frame times.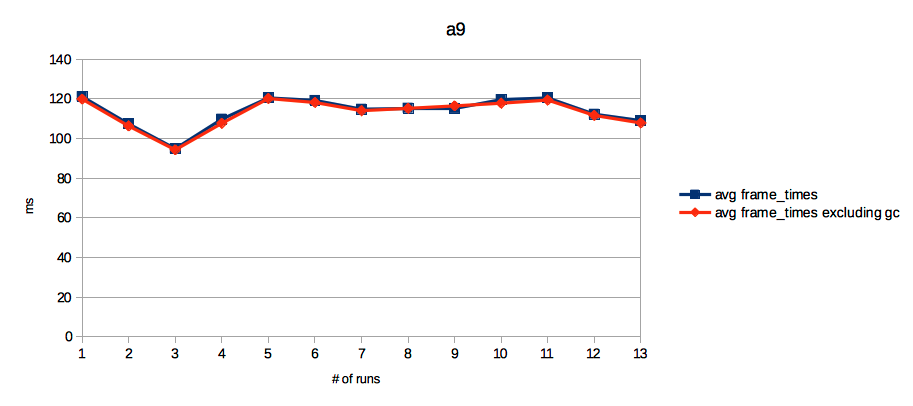
2) By comparing the average frame times of all frames and the average frame times of frames that contain no marking or sweeping, I think we can conclude that marking and sweeping is not affecting frame times.
On Tue, Aug 18, 2015 at 5:56 AM, Sigbjorn Finne <s...@opera.com> wrote:
- Keishi
Kentaro Hara
Aug 20, 2015, 5:58:00 AM8/20/15
to Keishi Hattori, Sigbjorn Finne, Hitoshi Yoshida, oilpan-...@chromium.org
Thanks for the result!
On Thu, Aug 20, 2015 at 6:19 PM, Keishi Hattori <kei...@google.com> wrote:
1) The 3,000,000 per frame number was calculated by dividing the difference in frame time with the amount of sleep I added, but it turns out it was way off. I added a counter to persistentAllocated/persistentFreed and observed that the actual number of times called is around 3,000 times per frame. Around 44% of that is from StyleRareNonInheritedData.
Hmm, 3000 doesn't sound too many. When you added the counter to persistentAllocated/persistentFreed, did it cause a regression in avg_frame_times? If no, we can conclude that the overhead of allocating/deallocating persistent handles is not the culprit of the regression.
2) By comparing the average frame times of all frames and the average frame times of frames that contain no marking or sweeping, I think we can conclude that marking and sweeping is not affecting frame times.
Thanks... The culprit should be outside the GC.
Also you were saying that PartitionAlloc's usage is mostly the same between non-oilpan and oilpan, which implies that the regression is not caused by a working set bloat in oilpan... The only idea I have might be bisecting :-/
Keishi Hattori
Aug 24, 2015, 4:20:17 AM8/24/15
to Kentaro Hara, Sigbjorn Finne, Hitoshi Yoshida, oilpan-...@chromium.org
I built and tested revisions from April, May, August and the one we used for the final report. All show around 10% regression.
2015-04-01 cc99318
https://257e68df4dae930120a4c67b6f7a507d5042fbc3.googledrive.com/host/0B4aiM9jljUy8UEh0QjR3SUVXaVE/2015-04-vanilla-vs-oilpan.html2015-04 final report
https://257e68df4dae930120a4c67b6f7a507d5042fbc3.googledrive.com/host/0B4aiM9jljUy8UEh0QjR3SUVXaVE/final-vanilla-vs-oilpan.html
https://257e68df4dae930120a4c67b6f7a507d5042fbc3.googledrive.com/host/0B4aiM9jljUy8UEh0QjR3SUVXaVE/final-vanilla-vs-oilpan.html
2015-05-01 9ce3458
2015-08-07 6b72d52
The results we sent in the final report show a 7.7% regression.
I'm thinking this isn't a new regression.
--
- Keishi
Kentaro Hara
Aug 24, 2015, 4:26:39 AM8/24/15
to Keishi Hattori, Sigbjorn Finne, Hitoshi Yoshida, oilpan-...@chromium.org
According to keishi-san's heap profiler, CSSValue is the most frequently allocated object (after applying a9).
I confirmed that almost all the CSSValues are PrimitiveCSSValues or CSSValueLists. Their sizes are 32 byte in non-oilpan, but 64 byte in oilpan. I'm writing a CL to reduce the 64 byte to 32 byte and see what happens.
Keishi Hattori
Aug 25, 2015, 12:44:49 AM8/25/15
to Kentaro Hara, Sigbjorn Finne, Hitoshi Yoshida, oilpan-...@chromium.org
I tested with several combination of the CLs below. Looks like changing CSSValue size has no effect.
--
- Keishi
Kentaro Hara
Aug 25, 2015, 2:58:17 AM8/25/15
to Keishi Hattori, Sigbjorn Finne, Hitoshi Yoshida, oilpan-...@chromium.org
Just FYI, this is a result on my Linux desktop.
master: ToT without oilpan
oilpan: ToT with oilpan
animation: ToT with AnimatableValue unshipped with oilpan
The result is flaky and thus not reliable. The former 15 results are from content_shell and the latter 15 results are from chrome. It is interesting that chrome runs faster than content_shell.
Kentaro Hara
Aug 25, 2015, 6:58:04 AM8/25/15
to Keishi Hattori, Sigbjorn Finne, Hitoshi Yoshida, oilpan-...@chromium.org
peria-san: Would it be possible to rebase your core/animations/ CL with ToT?
(I'll explain the details offline tomorrow.)
Hitoshi Yoshida
Aug 25, 2015, 8:41:42 AM8/25/15
to Kentaro Hara, Keishi Hattori, Sigbjorn Finne, oilpan-...@chromium.org
Kentaro Hara
Aug 25, 2015, 8:48:10 PM8/25/15
to Hitoshi Yoshida, Keishi Hattori, Sigbjorn Finne, oilpan-...@chromium.org
Thanks..
My plan was to create a CL that:
- ships Oilpan for core/animations/
- but unships Oilpan for AnimatableValues and InterpolableValues
by merging peria-san's CL and my CL. By doing that, we can exclude the effect of shipping Oilpan for CSSValues and Nodes.
But I noticed that the two CLs are not mergable, in theory.
(I'll work around the issue somehow.)
Keishi Hattori
Aug 25, 2015, 8:54:10 PM8/25/15
to Kentaro Hara, Hitoshi Yoshida, Sigbjorn Finne, oilpan-...@chromium.org
I'm merging them by hand.
--
- Keishi
Kentaro Hara
Aug 25, 2015, 8:58:41 PM8/25/15
to Keishi Hattori, Hitoshi Yoshida, Sigbjorn Finne, oilpan-...@chromium.org
I'm merging them by hand.
That is exactly what I was planning to start :)
Ping me if you need any help.
Kentaro Hara
Aug 25, 2015, 10:14:22 PM8/25/15
to Keishi Hattori, Hitoshi Yoshida, Sigbjorn Finne, oilpan-...@chromium.org
I created a CL to ship oilpan for a part of core/animations objects.
The CL ships oilpan only for the following classes:
AnimationEffect
EventDelegate
AnimationEffectTiming
AnimationTimeline
PlatformTiming
EffectModel
ElementAnimations
SampledEffect
RunningAnimation
keishi-san: Would you try this CL without oilpan and see if the regression is gone or not? If the regression is gone, I can add more classes (i.e., ship oilpan for more classes) to the CL. That way I hope we can identify the cause of the regression.
Kentaro Hara
Aug 25, 2015, 10:45:47 PM8/25/15
to Keishi Hattori, Hitoshi Yoshida, Sigbjorn Finne, oilpan-...@chromium.org
Just to clarify:
Compare ToT without oilpan vs. ToT + https://codereview.chromium.org/1318543009/ without oilpan.
Keishi Hattori
Aug 25, 2015, 11:21:11 PM8/25/15
to Kentaro Hara, Hitoshi Yoshida, Sigbjorn Finne, oilpan-...@chromium.org
Much better but there seems to be around a 5% regression. May I bisect to find problematic objects?
https://257e68df4dae930120a4c67b6f7a507d5042fbc3.googledrive.com/host/0B4aiM9jljUy8UEh0QjR3SUVXaVE/vanilla-vs-shippartial.html--
- Keishi
Kentaro Hara
Aug 26, 2015, 1:27:32 AM8/26/15
to Keishi Hattori, Hitoshi Yoshida, Sigbjorn Finne, oilpan-...@chromium.org
I created a CL to ship oilpan for a part of core/animations objects.
https://codereview.chromium.org/1318543009/
The CL ships oilpan only for the following classes:
AnimationEffect
EventDelegate
AnimationEffectTiming
AnimationTimeline
PlatformTiming
EffectModel
ElementAnimations
SampledEffect
RunningAnimation
I also moved InterpolationEffect to the heap.
If the performance is fine, I think it would be reasonable to propose landing the CL (without shipping Oilpan for other objects in core/animations/) for the following reasons:
- Moving the above objects already solve the lifetime problems that core/animations has wanted to solve with Oilpan. We don't necessarily need to move other objects.
- Other objects have a heavy allocation design (e.g., InterpolableValues, AnimatableValues, Keyframes etc). It wouldn't make sense to allocate them on a garbage-collected heap.
So, at the moment, our goal would be to achieve a good performance with the above CL.
Keishi Hattori
Aug 26, 2015, 2:45:33 AM8/26/15
to Kentaro Hara, Hitoshi Yoshida, Sigbjorn Finne, oilpan-...@chromium.org
Kentaro Hara
Aug 26, 2015, 2:58:50 AM8/26/15
to Keishi Hattori, Hitoshi Yoshida, Sigbjorn Finne, oilpan-...@chromium.org
Would you re-run ship-partial and ship-partial-2 again? I don't see any substantial difference between the two CLs; Maybe the 4% regression of ship-partial was just a flake?
Either way, I'm happy to see we're getting close :)
Keishi Hattori
Aug 26, 2015, 3:33:02 AM8/26/15
to Kentaro Hara, Hitoshi Yoshida, Sigbjorn Finne, oilpan-...@chromium.org
Yeah. I've rerun the test and I think I must have the wrong build for ship-partial-2. It is too good.
--
- Keishi
Kentaro Hara
Aug 26, 2015, 3:57:26 AM8/26/15
to Keishi Hattori, Yuta Kitamura, Hitoshi Yoshida, Sigbjorn Finne, oilpan-...@chromium.org
Thanks, let's make progress.
keishi-san, yuta-san: Would you collect full performance numbers for the following settings?
Measurement targets:
a) r201167 (without Oilpan)
b) r201167 + https://codereview.chromium.org/1318543009/ (withotu oilpan)
Benchmarks:
blink_perf.layout
blink_perf.layout_full_frame
smoothness.tough_animation_cases
smoothness.tough_animated_image_cases
Devices:
Nexus4 (yutak@)
Nexus7 (yutak@)
Linux (keishi@)
Kentaro Hara
Aug 26, 2015, 3:59:37 AM8/26/15
to Keishi Hattori, Yuta Kitamura, Hitoshi Yoshida, Sigbjorn Finne, oilpan-...@chromium.org
In parallel, it is important to identify where the 10% regression we're observing in oilpan builds is coming from. I'm suspecting CSSValues, so I'll create a CL to ship only CSSValues.
Keishi Hattori
Aug 26, 2015, 10:40:26 PM8/26/15
to Kentaro Hara, Yuta Kitamura, Hitoshi Yoshida, Sigbjorn Finne, oilpan-...@chromium.org
--
- Keishi
Kentaro Hara
Aug 27, 2015, 5:19:49 AM8/27/15
to Keishi Hattori, Yuta Kitamura, Hitoshi Yoshida, Sigbjorn Finne, oilpan-...@chromium.org
peria-san: As discussed in the sync-up, would you run the following benchmark in Windows?
Target benchmark:
tough_animation_cases
CLs:
a) ToT ( around r201292) without oilpan
b) ToT with oilpan
c) ToT + https://codereview.chromium.org/1276183004 with oilpan
Hitoshi Yoshida
Aug 27, 2015, 5:31:44 AM8/27/15
to Kentaro Hara, Keishi Hattori, Yuta Kitamura, Sigbjorn Finne, oilpan-...@chromium.org
Yep.
I'm building a) now. (it takes a long time :()
Kentaro Hara
Aug 27, 2015, 5:36:15 AM8/27/15
to Hitoshi Yoshida, Keishi Hattori, Yuta Kitamura, Sigbjorn Finne, oilpan-...@chromium.org
keishi-san: Here are CLs related to memory locality around CSSValues.
Reduce sizeof(CSSValue) by 8 byte
Reduce sizeof(Node) by 8 byte
Disable sized heap
Disable the CSSValue heap

Yuta Kitamura
Aug 28, 2015, 12:11:55 AM8/28/15
to Kentaro Hara, Keishi Hattori, Hitoshi Yoshida, Sigbjorn Finne, oilpan-...@chromium.org
Mobile results are ready:
blink_perf.layout_full_frame did not run successfully.
Keishi Hattori
Aug 28, 2015, 1:26:22 AM8/28/15
to Yuta Kitamura, Kentaro Hara, Hitoshi Yoshida, Sigbjorn Finne, oilpan-...@chromium.org
The data for just oilpan enabled is missing because of I made a typo in my script.
The frame times average ranges from -11% to -20% and don't seem to be consistent.
I'm going to rerun the tests with just the balls css transition tests.
https://257e68df4dae930120a4c67b6f7a507d5042fbc3.googledrive.com/host/0B4aiM9jljUy8UEh0QjR3SUVXaVE/disableheap.html--
- Keishi
Kentaro Hara
Aug 28, 2015, 2:03:27 AM8/28/15
to Keishi Hattori, Yuta Kitamura, Hitoshi Yoshida, Sigbjorn Finne, oilpan-...@chromium.org
As discussed yesterday, I created a CL to unship Oilpan from CSSValues (just for performance experiments).
keishi-san: Would you get performance numbers of css_properties_* for the following 8 builds?
ToT = r201292
CL | oilpan | Node | CSSValue | Animation | AnimtableValue | |
non-oilpan | ToT | off | F | F | F | F |
oilpan | ToT | on | T | T | T | T |
a | on | T | T | T | F | |
b | off | F | F | T | F | |
c | on | T | F | T | T | |
d | ToT + https://codereview.chromium.org/1318543009/ + https://codereview.chromium.org/1303173007 | off | F | F | T | F |
e | off | F | F | T | T | |
f | on | T | F | T | F |
Hitoshi Yoshida
Aug 30, 2015, 2:42:16 PM8/30/15
to Kentaro Hara, Keishi Hattori, Yuta Kitamura, Sigbjorn Finne, oilpan-...@chromium.org
Here is my test results on Windows
https://978437f2b4f3d8eed49d6cd4368788ae4ad2175c.googledrive.com/host/0B4QUVw-AB8wPeERxcTlQaVFFbEE20 times for each test using each build type.
a) ToT w/o Oilpan is "vanilla", b) ToT w/ Oilpan is "oilpan", and c) ToT + a CL w/ Oilpan is "patch"
This patch unship Oilpan from AnimatableValue/InterpolableValue classes.
Comparing these 3 builds,
1) Our target, frame_times, regresses ~5% on b), and ~3% on c) for balls_css_transition_{2|40|all}_properties.html.
Actually the regression appears, but its scale is much smaller than on Linux.
2) frame_time_discrepancy regresses largely on c), and c) has a few outlier. Does it mean c) runs more unstablly than a) and b)?
3) queueing_durations regresses hugely in percentage, but their actual numbers are 0.1~0.2ms. I think it is small enough to be ignored.
In total, I agree that the behavior of memory locality depends on platforms, and I feel we can go forward with shipping Oilpan
for core/animations except for AnimatableValues and InterpolableValue.
Kentaro Hara
Aug 30, 2015, 7:37:14 PM8/30/15
to Hitoshi Yoshida, Keishi Hattori, Yuta Kitamura, Sigbjorn Finne, oilpan-...@chromium.org
Thanks peria-san for the result!
I agree with your analysis.
- Let's unship oilpan from AnimatableValues and InterpolableValue.
- Regarding the regression c) (i.e., 10% regression in Linux, 3% regression in Windows, 0% regression in Nexus), it is likely that we're hitting some memory locality issue. Let's wait for keishi-san's experiments and figure out what we can do there.
Keishi Hattori
Aug 30, 2015, 10:41:59 PM8/30/15
to Kentaro Hara, Hitoshi Yoshida, Yuta Kitamura, Sigbjorn Finne, oilpan-...@chromium.org
The attached pdf is the summary. The effect of AnimatableValue don't agree but I think the 5% value is more accurate. CSSValue doesn't seem to be the problem. Node or whatever the oilpan build does elsewhere seems to be the cause.
raw results here: https://257e68df4dae930120a4c67b6f7a507d5042fbc3.googledrive.com/host/0B4aiM9jljUy8UEh0QjR3SUVXaVE/0829.html
--
- Keishi
Kentaro Hara
Aug 30, 2015, 11:37:27 PM8/30/15
to Keishi Hattori, Hitoshi Yoshida, Yuta Kitamura, Sigbjorn Finne, oilpan-...@chromium.org
Thanks, keishi-san. Maybe can you try the following CLs?
Reduce sizeof(Node) by 8 byte
Disable sized heap
Disable the CSSValue heap
Disable the Node heap
Keishi Hattori
Aug 31, 2015, 12:12:52 AM8/31/15
to Kentaro Hara, Hitoshi Yoshida, Yuta Kitamura, Sigbjorn Finne, oilpan-...@chromium.org
I already have data for three of those.
--
- Keishi
Kentaro Hara
Aug 31, 2015, 12:17:44 AM8/31/15
to Keishi Hattori, Hitoshi Yoshida, Yuta Kitamura, Sigbjorn Finne, oilpan-...@chromium.org
Thanks... no effect :-/
BTW, would you send me the minimized layout benchmark you created? I want to reproduce the regression reliably on my Linux machine.
Keishi Hattori
Aug 31, 2015, 12:25:41 AM8/31/15
to Kentaro Hara, Hitoshi Yoshida, Yuta Kitamura, Sigbjorn Finne, oilpan-...@chromium.org
This CL containing a bunch of tests I added. newballs-*s.html are the minimized tests. It sets a new CSS transition on all balls every N seconds.
--
- Keishi
Keishi Hattori
Aug 31, 2015, 5:35:00 AM8/31/15
to Kentaro Hara, Hitoshi Yoshida, Yuta Kitamura, Sigbjorn Finne, oilpan-...@chromium.org
Here are the results containing oilpan for the 4 benchmarks (blink_perf.layout, blink_perf.layout_full_frame, smoothness.tough_animation_cases, smoothness.tough_animated_image_cases).
I don't see any problems so hopefully we can use it to land https://codereview.chromium.org/1318543009/ .
https://257e68df4dae930120a4c67b6f7a507d5042fbc3.googledrive.com/host/0B4aiM9jljUy8UEh0QjR3SUVXaVE/vanilla-vs-oilpan-vs-shippartial.html--
- Keishi
Kentaro Hara
Aug 31, 2015, 5:36:19 AM8/31/15
to Keishi Hattori, Hitoshi Yoshida, Yuta Kitamura, Sigbjorn Finne, oilpan-...@chromium.org
keishi-san: Would you measure the following for css_properties_*?
ToT = around r201458
a) ToT without oilpan
b) ToT with oilpan
c) ToT + PS17 of https://codereview.chromium.org/1276183004 with oilpan
The PS17 unships oilpan from the Interpolation hierarchy.
Keishi Hattori
Aug 31, 2015, 11:16:22 PM8/31/15
to Kentaro Hara, Hitoshi Yoshida, Yuta Kitamura, Sigbjorn Finne, oilpan-...@chromium.org
results for 1276183004/PS17
--
- Keishi
Kentaro Hara
Sep 1, 2015, 12:18:09 AM9/1/15
to Keishi Hattori, Hitoshi Yoshida, Yuta Kitamura, Sigbjorn Finne, oilpan-...@chromium.org
Looks like a dramatic improvement?
Keishi Hattori
Sep 1, 2015, 12:31:55 AM9/1/15
to Kentaro Hara, Hitoshi Yoshida, Yuta Kitamura, Sigbjorn Finne, oilpan-...@chromium.org
Yes!
--
- Keishi
Sigbjorn Finne
Sep 12, 2015, 3:07:41 AM9/12/15
to Kentaro Hara, Keishi Hattori, Hitoshi Yoshida, oilpan-...@chromium.org
Den 8/17/2015 14:58, Kentaro Hara skreiv:
> Thanks for the result!
>
> On Mon, Aug 17, 2015 at 8:57 PM, Keishi Hattori <kei...@google.com
> <mailto:kei...@google.com>> wrote:
>
> Some results I collected today.
> "a9" is ToT+(a)+oilpan.
>
> 1) I've written a python script to extract frame times from trace files.
> The results for oilpan and a9 seem to contradict each other so I'll
> collect more samples tomorrow.
>
> vanilla oilpan a9
> exclude frames containing collectGarbage and lazySweep 102.6ms
> 113.7ms 106.1ms
> all frames 102.6ms 108.1ms 110.4ms
>
>
> 2) I've confirmed that Partitions::totalSizeOfCommittedPagesKB is
> around 108MB for vanilla, oilpan and a9.
> 3) I've added overhead to
> ThreadState::persistentAllocated/persistentFreed and confirmed
> ThreadState::persistentAllocated/persistentFreed is called around
> 3,000,000 times per frame.
>
>
> This sounds too many...
>
https://codereview.chromium.org/1335303002/ might reduce that count some.
> Thanks for the result!
>
> On Mon, Aug 17, 2015 at 8:57 PM, Keishi Hattori <kei...@google.com
> <mailto:kei...@google.com>> wrote:
>
> Some results I collected today.
> "a9" is ToT+(a)+oilpan.
>
> 1) I've written a python script to extract frame times from trace files.
> The results for oilpan and a9 seem to contradict each other so I'll
> collect more samples tomorrow.
>
> vanilla oilpan a9
> exclude frames containing collectGarbage and lazySweep 102.6ms
> 113.7ms 106.1ms
> all frames 102.6ms 108.1ms 110.4ms
>
>
> 2) I've confirmed that Partitions::totalSizeOfCommittedPagesKB is
> around 108MB for vanilla, oilpan and a9.
> 3) I've added overhead to
> ThreadState::persistentAllocated/persistentFreed and confirmed
> ThreadState::persistentAllocated/persistentFreed is called around
> 3,000,000 times per frame.
>
>
> This sounds too many...
>
--sigbjorn
Kentaro Hara
Sep 12, 2015, 3:55:55 AM9/12/15
to Sigbjorn Finne, Keishi Hattori, Hitoshi Yoshida, oilpan-...@chromium.org
While I was studying performance of textarea-edit, I noticed that a ton of persistent handles are created via ComputedStyle.
- ComputedStyle => StyleRareInheritedData => Persistent
- ComputedStyle => StyleRareNonInheritedData => Persistent
- ComputedStyle => StyleBackgroundData => FillLayer => Persistent
...
It is unfortunate that a lot of persistent handles are created just for creating an empty persistent handle, but as far as I experimented, it seems that the overhead of the persistent handle is not a bottleneck.
Sigbjorn Finne
Sep 13, 2015, 8:25:53 AM9/13/15
to Kentaro Hara, Keishi Hattori, Hitoshi Yoshida, oilpan-...@chromium.org
Den 9/12/2015 09:55, Kentaro Hara skreiv:
> While I was studying performance of textarea-edit, I noticed that a ton
> of persistent handles are created via ComputedStyle.
>
> - ComputedStyle => StyleRareInheritedData => Persistent
> - ComputedStyle => StyleRareNonInheritedData => Persistent
> - ComputedStyle => StyleBackgroundData => FillLayer => Persistent
> ...
>
> It is unfortunate that a lot of persistent handles are created just for
> creating an empty persistent handle, but as far as I experimented, it
> seems that the overhead of the persistent handle is not a bottleneck.
>
If you want to be lazier about instantiating PersistentNodes,
> While I was studying performance of textarea-edit, I noticed that a ton
> of persistent handles are created via ComputedStyle.
>
> - ComputedStyle => StyleRareInheritedData => Persistent
> - ComputedStyle => StyleRareNonInheritedData => Persistent
> - ComputedStyle => StyleBackgroundData => FillLayer => Persistent
> ...
>
> It is unfortunate that a lot of persistent handles are created just for
> creating an empty persistent handle, but as far as I experimented, it
> seems that the overhead of the persistent handle is not a bottleneck.
>
https://codereview.chromium.org/1338573003/
improves the situation a fair bit. I think we should use it.
Results:
Lazy = https://codereview.chromium.org/1338573003/
Oper = https://codereview.chromium.org/1335303002/
!ENABLE(OILPAN) loading https://google.com/:
PersistentNodes allocation count
ToT: 1850
ToT+Oper: 790
ToT+Oper+Lazy: 440
Live persistent count after load: 20
ENABLE(OILPAN) loading https://google.com/:
PersistentNodes allocation count
ToT: 31000
ToT+Oper: 13000
ToT+Oper+Lazy: 7800
Live persistent count after load: 125
--sigbjorn
Reply all
Reply to author
Forward
0 new messages