plugin tuning

David Bernard
I don't have lot of memory (4Go), but it's enough to daily code in
java with several projects,... But it's hell when I work on scala
projects (including or.scala-ide.sdt.core), to be able to spawn/debug
eclipse plugin I limit my eclipse IDE to 1024m.
But I raise limit quick limit, I've got lot freeze,... so I started to
"profile" and search :
* from mat (MemoryAnalyzer) the 2 main leak are
ScalaPresentationCompiler and EclipseBuildManager
* with visualvm rapid analyse, I saw that freeze are due to lot of GC
activity - can 40% - 80% CPU.
I try to investigate into code. I replace the
ScalaPresenrtationCompiler cache
(mutable.HashMap[ScalaCompilationUnit, CachedCompilerResult]) (in some
analyze there is 128 entries) by I simplist tuple, and now my IDE play
yo-yo with memory (with high amplitude I win ~ 100 Mo) but currently I
no longer have high GC activity.
I don't know if it's the right solution, but I would like to add a
PreferencePage "plugin tuning" where we could store configuration
about some strategies, experimental solutions. In my case, I'll start
with something like a check box for "cache AST" that allow to use
HashMap or my simple store (code bellow) after restart. I also think
it will be the good place for other/future customization (like
statistics generation, ...).
WDYT ?
/davidB
-----8<-----------------------------------------------------------------------
private val results = new Object{
private var _kv : (ScalaCompilationUnit,CachedCompilerResult) = null
def apply(k : ScalaCompilationUnit) = {
val kv = _kv
if (kv == null || kv._1 != k) {
val v = new CachedCompilerResult(k)
_kv = (k, v)
v
} else {
kv._2
}
}
def get(k : ScalaCompilationUnit) = {
val kv = _kv
if (kv == null || kv._1 != k) {
None
} else {
Some(kv._2)
}
}
def remove(k : ScalaCompilationUnit) {
val kv = _kv
if (kv != null && kv._1 == k) {
_kv = null
}
}
def keysIterator = _kv match {
case null => Nil
case kv => List(kv._1)
}
def valuesIterator = _kv match {
case null => Nil
case kv => List(kv._2)
}
}
-----8<-----------------------------------------------------------------------

Michel Krämer
I like the idea of improving the performance and reducing the memory
footprint. I believe, your solution reduces performance, although it
also uses less memory. A good tradeoff would be to use a map with soft
keys (SoftReference), so objects could be released when free memory
gets low. Unfortunately, the JDK only contains a WeakHashMap and not a
SoftHashMap. So, you may have to implement it yourself. Just for
testing purpose you could use Apache Commons Collections' ReferenceMap
and see if it really would help.
Michel

Martin Gamwell Dawids
We are currently using Scala in Eclipse for a large OSGi project. This
means we have approximately 50 projects in our workspace of which 35
are Scala projects. We have 8GB in one machine and 4GB in another
machine.
Even when we set -Xmx=2048M it starts out ok, but after a while gc
starts using all CPU power. Eventually you will have to restart
Eclipse, and if you wait too long, it is not even possible to quit/
restart Eclipse as it stops responding.
Without having analyzed anything, it definitely looks like something
in the Scala IDE is leaking memory.
We have a similar sized OSGi project with Java only which runs fine on
the same machines and which doesn't leak memory.
Regards,
Martin
David Bernard
Currently , from my user experience point of view, performance are
better (less freeze), but it's probably because I have less and
shorter GC activity.
I have done a SoftReferenceCacheMap (SoftReference for value) in scala
2 years ago. I'll try to combine it with the cache for only the latest
entry (should not be removable, to avoid eviction and
recomputation,...) In fact I would like to use something like ehcache
to replace all those cache (and adjust strategy , size,... of thoses
cache).
@Martin, Michel
Thanks for feedbacks.
/davidB
PS: As I'm a newbee in Eclipse developement (and Scala-ide), have a
soft desktop ;-) (I bought a SSD HD to improve, not yet installed). I
need lot of time to investigate, try, experiment so more time to have
public effect.

Mirko Stocker
I welcome every attempt at improving performance; I've now worked several
months with the Scala IDE and before that many years with Eclipse - and I
never had to restart Eclipse so much as now with the Scala plugin..
On Tuesday 13 July 2010 16:07:53 David Bernard wrote:
> -----8<--------------------------------------------------------------------
> --- private val results = new Object{
What type does results have now? Won't this lead to the same problems -- that
a structural type is created -- mentioned here: http://www.scala-
notes.org/2010/06/avoid-structural-types-when-pimping-libraries/ ? I'm not
sure how much it actually matters, but when we're already optimizing...
Cheers
Mirko
--
Mirko Stocker | m...@misto.ch
Work: http://ifs.hsr.ch | http://infoq.com
Personal: http://misto.ch | http://twitter.com/m_st
David Bernard
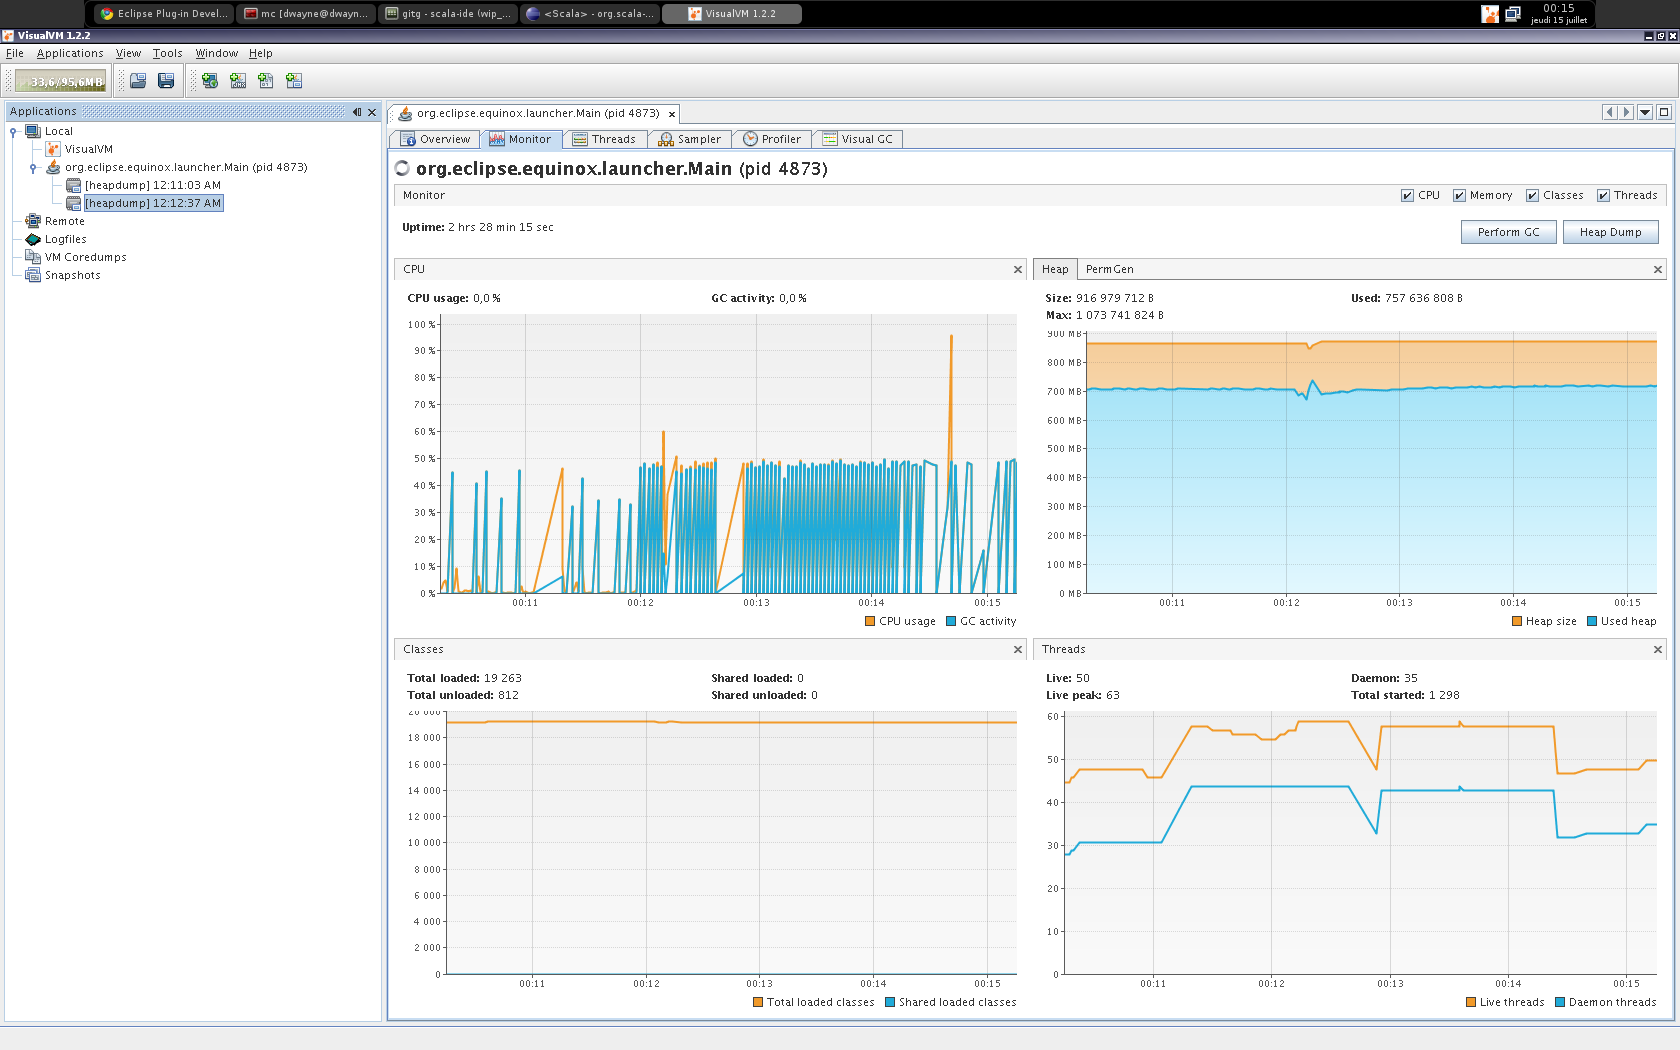
Eg when my eclipse start to freeze
1. I start a visualvm (could be download alone or use the one provide
in jdk 1.6.0_21)
2. I open the monitor of the eclipse process
3. I wait few second, take a screenshot (see attachment)
for gc and memory issue I also do a Heap dump (and save it for
postmordem analyze with VisualVM or Mat).
@Mirko
In my local wip_tuning branch I replace new Object{...} by named classe.
the link you provide seems to be invalid.
/davidB
David Bernard
is based on tycho-reorg branch):
update site (include full scala-ide plugin) :
http://alchim31.net/scala-ide/update-wip_tuning
or just the plugin jar
http://alchim31.net/scala-ide/update-wip_tuning/plugins/org.scala-ide.sdt.core_1.0.0.201007150057.jar
/davidB
David Bernard
I start a wiki page to keep a more 'structured' trace :
http://www.assembla.com/wiki/show/scala-ide/WIP_Tuning
/davidB
On Jul 15, 1:19 am, David Bernard <david.bernard...@gmail.com> wrote:
> In case, someone who want to give a try to my wip_tuning (note that it
> is based on tycho-reorg branch):
> update site (include full scala-ide plugin) :http://alchim31.net/scala-ide/update-wip_tuning
>
David Bernard
updates includes :
* re-sync with last works on tycho-reorg branch
* replace home made SoftHashMap by a WeakSoftHashMap build with
google-collections MapMaker to cache/memoize result of Presentation
compilation
* (start) integrate StopWatch (form alex Boisvert) to count/mesure
some compilations (from builder and presentation)
by exemple on test project, writing : def foo() = "hhhh"[enter]
generate 10 compilation (I tried to call to code completion), with the
default configuration (If I understand right, JDT call completion
engine every 200ms if there is typing)
In this version, stopwatch are always enabled, to disable or to see
data collected open your browser (or eclipse internal browser) to
http://localhost:9999/
Note that as I require 2 additional plugins (stopwatch who is provide
by same update-site as scala-ide and google-collections provide by
orbit update (I hope you don't need to declare it)). tell me if you
have issue to install this version.
/davidB

Jin Mingjian
David Bernard
I have Xmx set to 1g (my full eclipse.ini below, may be I've got some
misconfiguration). When I work on org.scala-ide.sdt.core my used
memory (is ~ 750MB from The eclipse indicator (enabled via Prefences >
General)).
If i go into an other scala enabled project then when eclipse "build
workspace" I've got more freeze And If I display visualvm I can see
increase of GC Activy (see screenshot) until full freeze (like Martin
Gamwell Dawids).
I also note some freeze due with usage of SyncVar, but as I explain,
they could be reduced (in quantity) by reducing call to
ScalaCompletionEngine (call too frequencly and generate unsuable AST
for code completion suggestion, eg : (in sample pipe char is use to
mark caret position)
"bablbla".| <-- some code suggestion proposed
"bablbla".to| <-- no code suggestion
"bablbla".|to <-- no code suggestion (I expect to have as first case)
)
On the WIP_Tuning page I start listing proposal, idea to improve,...
I thinks we (developpers and users) could start a page on User
Documentation part about some "eclipse tuning suggestion" about
performance, usage,... (with preferences configuration or usefull
complementary plugins to install)
DISCLAIMER : I'm not a optimization and profiling expert
~~~~~~
-startup
plugins/org.eclipse.equinox.launcher_1.0.201.R35x_v20090715.jar
--launcher.library
plugins/org.eclipse.equinox.launcher.gtk.linux.x86_64_1.0.200.v20090519
-showsplash
org.eclipse.platform
--launcher.XXMaxPermSize
384m
-vmargs
-server
-XX:PermSize=256m
-XX:MaxPermSize=384m
-Xss2m
-Xms512m
-Xmx1g
-XX:MaxGCPauseMillis=10
-XX:+ScavengeBeforeFullGC
-XX:-UseParallelOldGC
-Duser.name=david.bernard
-Dosgi.requireJavaVersion=1.5
-XX:+HeapDumpOnOutOfMemoryError
-XX:+CMSClassUnloadingEnabled
#-Xms256m
#-Xmx1024m
#-Xss1m
#-server
#-XX:+UseConcMarkSweepGC
~~~~~
Jin Mingjian
Jin Mingjian

Daniel Ratiu
I think that the improvement of the speed of the plugin is essential
for its acceptance and thereby the efforts for plugin tuning will pay
off.
I also have a small contribution that optimizes the plugin (it
actually speeds up the building of the top-map for the project files)
Basically, my improvement is to replace a line from
ScalaProject.topLevelMap
instead of:
allSourceFiles.map(topLevelMap0.update)
I propose the line:
topLevelMap0.update(allSourceFiles)
In the original version (the first one) the methods TopLevelMap.update
and, in turn, TopLevelMap.parse are called once for each file. This is
highly inefficient!!!
Below is a complete patch (it comprises small modifications of the
files ScalaProject and TopLevelMap)
According to my measurements, the speed improvement in building the
"top-level map" is around 10%.
Cheers,
Daniel
------------------ patch start
diff --git a/org.scala-ide.sdt.core/src/scala/tools/eclipse/
ScalaProject.scala b/org.scala-ide.sdt.core/src/scala/tools/eclipse/
ScalaProject.scala
index 20ef850..e9036fe 100644
--- a/org.scala-ide.sdt.core/src/scala/tools/eclipse/
ScalaProject.scala
+++ b/org.scala-ide.sdt.core/src/scala/tools/eclipse/
ScalaProject.scala
@@ -333,7 +333,7 @@ class ScalaProject(val underlying : IProject) {
topLevelMap0 = new TopLevelMap
println("Building top-level map for: "+underlying.getName)
val start = System.currentTimeMillis
- allSourceFiles.map(topLevelMap0.update)
+ topLevelMap0.update(allSourceFiles)
val end = System.currentTimeMillis
println("Time: "+(end-start))
}
@@ -353,7 +353,7 @@ class ScalaProject(val underlying : IProject) {
}
def updateTopLevelMap(file : IFile) {
- topLevelMap.update(file)
+ topLevelMap.update(List(file))
}
def resetTopLevelMap {
diff --git a/org.scala-ide.sdt.core/src/scala/tools/eclipse/
TopLevelMap.scala b/org.scala-ide.sdt.core/src/scala/tools/eclipse/
TopLevelMap.scala
index 0701a64..84a653a 100644
--- a/org.scala-ide.sdt.core/src/scala/tools/eclipse/TopLevelMap.scala
+++ b/org.scala-ide.sdt.core/src/scala/tools/eclipse/TopLevelMap.scala
@@ -28,7 +28,7 @@ class TopLevelMap {
def sourceFileFor(qualifiedName : String) =
typeToFile.get(qualifiedName)
- def parse(files : List[IFile]) {
+ def parse(files : Iterable[IFile]) {
import compiler.{ ClassDef, CompilationUnit, GlobalPhase,
ModuleDef, nme, PackageDef, Traverser, Tree }
import compiler.syntaxAnalyzer.UnitParser
@@ -79,10 +79,9 @@ class TopLevelMap {
fileToTypes.remove(file)
}
- def update(file : IFile) {
- if (file.getFileExtension == "scala") {
- remove(file)
- parse(List(file))
- }
+ def update(files : Iterable[IFile]) {
+ val scalaFiles = files.filter(f => f.getFileExtension == "scala");
+ scalaFiles.foreach(f => remove(f));
+ parse(scalaFiles)
}
}
----------------- patch end

Miles Sabin
> Basically, my improvement is to replace a line from
> ScalaProject.topLevelMap
>
> instead of:
> allSourceFiles.map(topLevelMap0.update)
>
> I propose the line:
> topLevelMap0.update(allSourceFiles)
>
> In the original version (the first one) the methods TopLevelMap.update
> and, in turn, TopLevelMap.parse are called once for each file. This is
> highly inefficient!!!
> Below is a complete patch (it comprises small modifications of the
> files ScalaProject and TopLevelMap)
>
> According to my measurements, the speed improvement in building the
> "top-level map" is around 10%.
This looks promising, but could you confirm that the map is completed
for *all* the source file passed in, if there is an error in one of
them?
If there aren't any problems, then please go ahead and push this to
the tycho-reorg branch.
Many thanks :-)
Cheers,
Miles
--
Miles Sabin
tel: +44 7813 944 528
gtalk: mi...@milessabin.com
skype: milessabin
http://www.chuusai.com/
http://twitter.com/milessabin
Daniel Ratiu
> This looks promising, but could you confirm that the map is completed
> for *all* the source file passed in, if there is an error in one of
> them?
in one file. It seems to work -- by doing a "project clean" the top-
level map is built for all files.
By taking a look at the implementation of UnitParser I noticed that
the the method always returns a Tree object (that can be an empty
tree).
Do you know other cases that I should be aware of?
@all: I've noticed that the presentation compiler is destroyed and
completely reinitialized *every* time a scala source file is saved
(call chain below)
ScalaSourceFileEditor.doSave ->
ScalaProject.scheduleResetPresentationCompiler -> etc.
I think that this pessimistic treatment of the PresentationCompiler
(i.e. a complete reinitialization for each file save) is a possible
source for the performance bottleneck.
Furthermore, in this area might occur also some memory leaks (e.g.
objects of CompilerResultHolder that continue to hang around after the
presentation compiler is destroyed).
WDYT?
Cheers,
Daniel
Miles Sabin
>> This looks promising, but could you confirm that the map is completed
>> for *all* the source file passed in, if there is an error in one of
>> them?
> I tested my solution on a scala project in which I injected an error
> in one file. It seems to work -- by doing a "project clean" the top-
> level map is built for all files.
Right, this is why the files are parsed individually currently ... we
don't want to require continuous cleaning.
If you can come up with some mechanism for batching the files which
accommodates failures (ie. retrying with the failing file excluded)
and that mechanism still shows a significant speedup then that would
be well worth having :-)
> @all: I've noticed that the presentation compiler is destroyed and
> completely reinitialized *every* time a scala source file is saved
> (call chain below)
> ScalaSourceFileEditor.doSave ->
> ScalaProject.scheduleResetPresentationCompiler -> etc.
>
> I think that this pessimistic treatment of the PresentationCompiler
> (i.e. a complete reinitialization for each file save) is a possible
> source for the performance bottleneck.
Unfortunately it's necessary as a workaround for bugs in the
presentation compiler ... it's unable to cope with changes in the set
of top-level types. See,
http://scala-ide.assembla.com/spaces/scala-ide/tickets/2689
for example ... there are other related bugs which the presentation
compiler reset addresses.
> Furthermore, in this area might occur also some memory leaks (e.g.
> objects of CompilerResultHolder that continue to hang around after the
> presentation compiler is destroyed).
Those should be invalidated fairly promptly ... can you point me at a
case where that doesn't happen?
Cheers,
Miles
--
Miles Sabin
tel: +44 7813 944 528
gtalk: mi...@milessabin.com