bug in plot3d?
15 views
Skip to first unread message

Alex Ghitza
May 30, 2009, 8:10:39 PM5/30/09
to sage-...@googlegroups.com
I have tried this in 3.4.1, 3.4.2, and 4.0.rc2, without success:
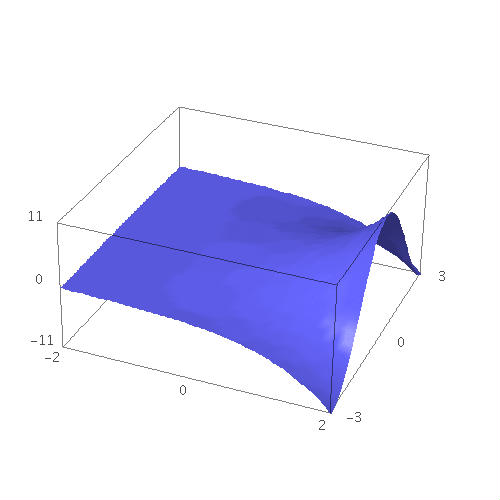
plot3d(lambda x,y: exp(x+y*I).real(), (-2, 2.4), (-3, 3), mesh=True)
I get a nice looking surface (see attached jpeg file), but no mesh
lines. Is anybody else experiencing this?
Best,
Alex
--
Alex Ghitza -- Lecturer in Mathematics -- The University of Melbourne
-- Australia -- http://www.ms.unimelb.edu.au/~aghitza/

mark mcclure
May 31, 2009, 10:28:24 AM5/31/09
to sage-devel
On May 30, 8:10 pm, Alex Ghitza <aghi...@gmail.com> wrote:
> I have tried this in 3.4.1, 3.4.2, and 4.0.rc2, without success:
>
> plot3d(lambda x,y: exp(x+y*I).real(), (-2, 2.4), (-3, 3), mesh=True)
>
> I get a nice looking surface (see attached jpeg file), but no mesh
> lines. Is anybody else experiencing this?
I get the same behavior with plot3d and with parametric_plot3d.
> I have tried this in 3.4.1, 3.4.2, and 4.0.rc2, without success:
>
> plot3d(lambda x,y: exp(x+y*I).real(), (-2, 2.4), (-3, 3), mesh=True)
>
> I get a nice looking surface (see attached jpeg file), but no mesh
> lines. Is anybody else experiencing this?
I seem to recall mesh=True working properly a few versions
ago.
Mark McClure

William Cauchois
Jun 1, 2009, 3:51:00 AM6/1/09
to sage-...@googlegroups.com
I looked into this, and I found that the mesh=True property is
supposed to be passed via RenderParams to jmol_repr(). However, this
isn't happening. Graphics3d.export_jmol (which is invoked by show())
has a keyword parameter for mesh, but it is never referenced in the
body of the function. I think that setting simply render_params.mesh =
mesh after render_params is initialized should do the trick. Does
anybody know where/how this functionality was broken?
(Also it looks like dots may be broken as well?)
I will open a ticket tomorrow and submit a patch.
-- Bill
William Cauchois
Jun 2, 2009, 4:34:59 AM6/2/09
to sage-...@googlegroups.com

Marshall Hampton
Jun 2, 2009, 8:18:11 AM6/2/09
to sage-devel
I have given a positive review. I didn't do a huge amount of testing
but it seems like a very straightforward patch.
-Marshall
On Jun 2, 3:34 am, William Cauchois <wcauc...@u.washington.edu> wrote:
> A fix is up at <http://trac.sagemath.org/sage_trac/ticket/6184>, and
> needs a review!
>
> On Mon, Jun 1, 2009 at 12:51 AM, William Cauchois
>
but it seems like a very straightforward patch.
-Marshall
On Jun 2, 3:34 am, William Cauchois <wcauc...@u.washington.edu> wrote:
> A fix is up at <http://trac.sagemath.org/sage_trac/ticket/6184>, and
> needs a review!
>
> On Mon, Jun 1, 2009 at 12:51 AM, William Cauchois
>
> <wcauc...@u.washington.edu> wrote:
> > I looked into this, and I found that the mesh=True property is
> > supposed to be passed via RenderParams to jmol_repr(). However, this
> > isn't happening. Graphics3d.export_jmol (which is invoked by show())
> > has a keyword parameter for mesh, but it is never referenced in the
> > body of the function. I think that setting simply render_params.mesh =
> > mesh after render_params is initialized should do the trick. Does
> > anybody know where/how this functionality was broken?
>
> > (Also it looks like dots may be broken as well?)
>
> > I will open a ticket tomorrow and submit a patch.
>
> > -- Bill
>

Peter
Jun 2, 2009, 12:05:50 PM6/2/09
to sage-devel
Here is another strange plot3d behavior (taken from the plot3d
docstring and slightly modified):
sage: plot3d(lambda x, y: x^2 + y^2, (-2,2), (-2,2)) # works as
expected
but
sage: plot3d(lambda x, y: x^2 + y^2, (0,2), (0,2)) # throws an
exception
Traceback (most recent call last):
File "<stdin>", line 1, in <module>
File "/home/jipsen/.sage/sage_notebook/worksheets/jipsen/8/code/
62.py", line 7, in <module>
plot3d(lambda x, y: x**_sage_const_2 + y**_sage_const_2 ,
(_sage_const_0 ,_sage_const_2 ), (_sage_const_0 ,_sage_const_2 ))
File "/home/jipsen/temp/sage-4.0/local/lib/python2.5/site-packages/
Jinja-1.2-py2.5-linux-i686.egg/", line 1, in <module>
File "/home/jipsen/temp/sage-4.0/local/lib/python2.5/site-packages/
sage/plot/plot3d/plot3d.py", line 195, in plot3d
P = parametric_plot3d.parametric_plot3d(w, urange, vrange, **kwds)
File "/home/jipsen/temp/sage-4.0/local/lib/python2.5/site-packages/
sage/plot/plot3d/parametric_plot3d.py", line 500, in parametric_plot3d
raise ValueError, "plot variables should be distinct, but both are
%s."%(urange[0],)
ValueError: plot variables should be distinct, but both are 0.
Strangly enough the following works ok again:
sage: plot3d(lambda x, y: x^2 + y^2, (0,2), (-0,2))
The error checking is meant to catch problems like
sage: plot3d(sin(x), (x,0,2), (x,0,2))
but the check seems to also be applied to plot3d(f, (a,b), (c,d)).
Regards,
Peter
Reply all
Reply to author
Forward
0 new messages