Notebook editing and interactive plotting (jquery?)

Maurizio
sorry for kind of flooding this group, but I'm very eager to learn.
I'd like to understand how to add another javascript script to the
notebook. In particular, I'd like to test FLOT for interactive
plotting.
The problem is that I am unable to call another script from the
notebook, because I cannot find a suitable version of the source to
work with.
My intention is doing something similar to what jsMath (as far as I
understood the code) does: launch a function which returns even a
simple text string, that should become the argument of the script
launcher.
I'd like to avoid passing through file saving and html() command (that
was the first try, but doesn't seem so polite).
Is there another way to do it? I mean, a way that could allow us to
make an spkg at the end, so something that doesn't need to modify the
notebook code?
Thanks
Maurizio

Jason Grout
You could do something like the tinymce plugin, or the jsmath_imagefonts
spkg. Basically, test for the existence of the spkg, and then do the
FLOT plotting if the spkg exists. You can see an example in the code
for jsmath_imagefonts, I believe, in the top of notebook.py.
Jason

Kenny
looked at the FLOT package and it seems very promising. Hope to
find soon a package to easily include flot into sage notebook!
Would be nice to have a pop-up windows that include the graphic and
be able to interact with it from the notebook with some commands
similar to the ones used in matlab.
I know this not an answer to your question but... keep working it will
be
helpful for a lot of people!
Maurizio
thank you for your quick response.
Actually, I can't check for any spkg existence, since there isn't any
(still...). What I want, is to plugin another javascript (flot) in my
notebook basically, and then make it load from the notebook itself,
passing some data (vectors of point, for 2d plotting) without having
to use intemediate html() function (I think that would make too much
overhead, isn't it?)
Could you please be a little bit more precise to show me where to look
at for an example?
I would be very grateful for that!
Once I get a readable example, I think I could go along by myself.
thanks
Maurizio
Jason Grout
> Hi all,
> sorry for kind of flooding this group, but I'm very eager to learn.
>
> I'd like to understand how to add another javascript script to the
> notebook. In particular, I'd like to test FLOT for interactive
> plotting.
I should add that FLOT has been discussed before and I think lots of
people would like to see FLOT plotting in Sage. So keep up the good work!
See
http://groups.google.com/group/sage-devel/search?group=sage-devel&q=FLOT&qt_g=Search+this+group
for previous discussions involving FLOT.
Jason

Alfredo Portes
http://code.google.com/p/protochart/
Kenny
instead of flot??
Jason Grout
> Is there any good reason for using flotr, protochart or any other
> instead of flot??
someone needs to post a message to sage-devel calling for a vote and
explaining why the proposed package is better than anything else, etc.
Having a prototype of something working would be advantageous for
letting people try it out before voting.
Jason

mabshoff
On Feb 23, 9:00 am, Jason Grout <jason-s...@creativetrax.com> wrote:
> Kenny wrote:
> > Is there any good reason for using flotr, protochart or any other
> > instead of flot??
>
> I don't know. In order to standardize on flot or anything else, though,
> someone needs to post a message to sage-devel calling for a vote and
> explaining why the proposed package is better than anything else, etc.
> Having a prototype of something working would be advantageous for
> letting people try it out before voting.
based plotting code seems to require canvas support (or at least takes
advantage of it), so IE support might be an issue here. I also fail to
see yet why this is significantly better and/or not achievable with
MPL and/or jmol. I am all for experimenting to see what is possible,
but I would not be in favor of adding another 2D plotting library to
Sage while we have MPL.
That is obviously taking about standard Sage. A hook into the notebook
code to check if some of the above libraries is installed via some
optional library seems more than reasonable.
> Jason
Cheers,
Michael
Jason Grout
> Jason,
> thank you for your quick response.
>
> Actually, I can't check for any spkg existence, since there isn't any
> (still...). What I want, is to plugin another javascript (flot) in my
> notebook basically, and then make it load from the notebook itself,
> passing some data (vectors of point, for 2d plotting) without having
> to use intemediate html() function (I think that would make too much
> overhead, isn't it?)
>
> Could you please be a little bit more precise to show me where to look
> at for an example?
> I would be very grateful for that!
>
> Once I get a readable example, I think I could go along by myself.
>
Maurizio,
I think that I would start out by getting a working example using
html(), so that other people could easily try it. Here's what I would do:
* upgrade to sage 3.3, since a lot of the locations of javascript
things changed in 3.3.
* Put the javascript library into $SAGE_ROOT/local/notebook/javascript
(you can see the other javascript libraries are in that directory too).
* Now you can load a javascript library by doing
<script type="text/javascript"
src="/javascript_local/my_js_dir/my_js_file.js"></script>
(/javascript_local is mapped to $SAGE_ROOT/local/notebook/javascript)
* Do an example using html() to load the javascript library and call
the necessary javascript functions. This keeps everything in the
notebook so people get a feel for how to interact with the library, and
it saves you from having to dig into the internals of how Sage Graphics
objects are displayed.
Thanks,
Jason
Jason Grout
Right now, I think the best solution for us would be some sort of html
canvas backend for matplotlib. However, I haven't looked closely at the
javascript plotters (just played with them for a bit).
Having a canvas dependency isn't a showstopper, I don't think. IE
doesn't support it, but there are multiple solutions to bring canvas to
IE, including at least a javascript library
(http://code.google.com/p/explorercanvas/) and an activex control
(http://blog.vlad1.com/2008/07/30/no-browser-left-behind/). According
to
http://arstechnica.com/software/news/2008/08/mozilla-drags-ie-into-the-future-with-canvas-element-plugin.ars,
the javascript library is what makes google maps work with IE, so I'd
guess it's pretty well tested and it works.
Jason
Maurizio
I understand your comments, but my desire to include something like
Flot comes from the need of having dynamic zooming and panning, and
tooltips and something else like that. Is this possible with
matplotlib? I didn't find the way to do it.
On the contrary, even the simplest javascript plot library allows for
these features, but they obviously lack in other areas.
For example, my first intention was to have the bode plots
implemented, to make them easily browsable, but I discovered that none
of these js plotting packages have the semilog or loglog option, and
making it work was quite a pain...
Today we (Kenny and me) have a working alpha. It is unfinished, but we
think that these added capabilities show the possible advantages, if
someone wants to work a little bit on that. In this case, in my
opinion, we are not talking about doing the same thing with two
overlapping packages. On the contrary, we are addressing two
completely different issues. Infact, we will probably stay with MPL as
far as saving PNG are concerned (probably the best way to incorporate
plots in the notebook), but certainly go with this FLOT when working
within the browser.
We hope to send you some example ASAP, so that you can judge yourself
and the decide what to do.
Regards
Maurizio
Jason Grout
> Michael,
> I understand your comments, but my desire to include something like
> Flot comes from the need of having dynamic zooming and panning, and
> tooltips and something else like that. Is this possible with
> matplotlib? I didn't find the way to do it.
As I understand it, matplotlib can do those sorts of things with an
interactive backend (i.e., wxwindows, gtk, qt, etc.). However, none of
those work with the web-based notebook, but the pieces are there. It
would be *cool* if someone would write the necessary
javascript/canvas/html code to make those tools available in a "canvas"
backend. Again, something like the gnuplot canvas backend. You might
be able to even reuse code from the gnuplot canvas backend.
That said, it may be less effort to make an optional flot spkg.
However, for advanced plotting and deep integration with Sage, as you
are seeing, leveraging the power of matplotlib by just writing another
backend may be the best way to go in the end.
I've looked at writing a matplotlib backend, and it didn't look
extremely difficult. There are examples in the backends/ directory, and
it looks like you can get a minimal backend up and running by just
writing a few functions.
You're doing some great work on getting Flot working too! I think
exploring the options is what is most valuable at this point. I just
think that the matplotlib backend is one of the most valuable options
that can be explored.
> Today we (Kenny and me) have a working alpha. It is unfinished, but we
> think that these added capabilities show the possible advantages, if
[snip]
>
> We hope to send you some example ASAP, so that you can judge yourself
> and the decide what to do.
I look forward to seeing what you have!
Jason
Alfredo Portes
On Mon, Feb 23, 2009 at 8:55 AM, Kenny <masso...@gmail.com> wrote:
>
> Is there any good reason for using flotr, protochart or any other
> instead of flot??
Just wanted to point out some other libraries available. I was under
the impression you
just started looking at some way of doing this, but I see in emails
from Maurizio in this
thread that you have some code already with Flot. These are some of
the libraries
I have looked at before (some with 3D capabilities) to do some
plotting for Axiom, but did
not get to decide on one (including Flot). Good luck on your work.
Regards,
Alfredo
Maurizio
Honestly, I totally second your idea that using the same matplotlib
would have probably been the best choice from the very first moment.
Please also keep in mind that I am not a software developer, and that
the time spent on this should be like an investment to speed up my
future work, but unfortunately I can't really work on this all day ;)
Before starting to write down some lines of code, we had a look at the
gnuplot Canvas page (http://skuld.bmsc.washington.edu/~merritt/gnuplot/
canvas_demos/ ) , and I was disappointed by not seeing a single
example (there are more than 20, I certainly not looked at them all),
about fast and useful interaction with the plots. I mean, apart from
enabling a grid, what's the big deal (from my point of view, as a
user) in having such a Canvas thing, if the result is having a static
image? What do I know that the interaction is still possible, if they
don't show in any way its possibilities? Panning, zooming, turning 3d
objects, and other stuff should be the real target in my opinion!
Have a look at the FLOT example page: http://people.iola.dk/olau/flot/examples/
. Apart from the very basic ones, the selection tool, zooming tool,
online enabling of series, etc, looks very attractive to my eyes!
Moreover, if it hadn't been for the fact of semilog or loglog plots,
the work of including the plot in the sage notebook was done by this
morning!!
So at the end of this long day, my thoughts are:
- FLOT is not so powerful, and the other derivatives (FLOTR,
Protochart, etc) don't seem to be any better ( I can hardly recognize
the differences), but still it is very fast to develop with in simple
cases
- matplotlib is obviously the most powerful and well integrated (my
previous bode plot function relied on matplotlib), but I have some
doubts about whether the rendering time would be small enough to
provide a sufficiently satisfying user experience
I hope you will hear from us pretty soon
Regards
Maurizio
Jason Grout
> Thank you very much for your encouragement.
> Honestly, I totally second your idea that using the same matplotlib
> would have probably been the best choice from the very first moment.
> Please also keep in mind that I am not a software developer, and that
> the time spent on this should be like an investment to speed up my
> future work, but unfortunately I can't really work on this all day ;)
I know. We all face constraints on our time. We *really* appreciate
you looking at all of this!
>
> Before starting to write down some lines of code, we had a look at the
> gnuplot Canvas page (http://skuld.bmsc.washington.edu/~merritt/gnuplot/
> canvas_demos/ ) , and I was disappointed by not seeing a single
> example (there are more than 20, I certainly not looked at them all),
> about fast and useful interaction with the plots. I mean, apart from
> enabling a grid, what's the big deal (from my point of view, as a
> user) in having such a Canvas thing, if the result is having a static
> image? What do I know that the interaction is still possible, if they
> don't show in any way its possibilities? Panning, zooming, turning 3d
> objects, and other stuff should be the real target in my opinion!
I agree. The grid and the clicking is a start (i.e., it's getting input
from the browser and using that to change something, the mouse
coordinates displayed). I hope my comments helped us realize that, with
other interactive backends, matplotlib does do panning, zooming, etc. I
hope that a canvas backend for matplotlib would implement the exact same
sort of features. I saw the gnuplot demo as just a proof-of-concept
demo showing that it was possible to automatically generate an
interactive graph for a web browser.
>
> Have a look at the FLOT example page: http://people.iola.dk/olau/flot/examples/
> .. Apart from the very basic ones, the selection tool, zooming tool,
> online enabling of series, etc, looks very attractive to my eyes!
> Moreover, if it hadn't been for the fact of semilog or loglog plots,
> the work of including the plot in the sage notebook was done by this
> morning!!
>
> So at the end of this long day, my thoughts are:
> - FLOT is not so powerful, and the other derivatives (FLOTR,
> Protochart, etc) don't seem to be any better ( I can hardly recognize
> the differences), but still it is very fast to develop with in simple
> cases
I agree that FLOT isn't that powerful compared to matplotlib, but the
functionality is much, much easier to access. I look forward to seeing
a demo of what you've done.
> - matplotlib is obviously the most powerful and well integrated (my
> previous bode plot function relied on matplotlib), but I have some
> doubts about whether the rendering time would be small enough to
> provide a sufficiently satisfying user experience
I see the "canvas" backend to matplotlib being just like the FLOT tool
(indeed, maybe one could even use the FLOT library to do it!). The
matplotlib backend just needs to be able to draw some basic shapes (like
lines and text) and provide some sort of interface for interaction. All
of this should be documented in the matplotlib docs and/or code, and
help is available on the matplotlib list.
That said, I haven't actually developed a matplotlib backend. If one
were interested in working on a canvas (or even a FLOT) backend to
matplotlib, it would probably be best to take things to the matplotlib list.
We really, really appreciate the work you've done in getting FLOT to
work. I think it's a great thing to have available, and FLOT certainly
looks nice. My comments were just to point out that, with more work
than FLOT entails, we could have maybe the best of both worlds
(functionality and javascript/canvas goodness).
Anyways, I look forward to seeing what you have with FLOT.
Jason

Tom Boothby
We can work out log plots in the future. Hell, the FLOT people might
even do that for us if we ask really nice and show them how awesome
Sage looks with FLOT vs. how sad I look when I have to wait for
matplotlib to render an image.
--tom
Tom Boothby

Rob Beezer
"interactive graph editor" (meaning graphs as in graph theory, not
graphs as in plots of data).
http://trac.sagemath.org/sage_trac/ticket/1321
It'd be great if there was some infrastructure for creating a graph in
the notebook by clicking to make vertices, dragging vertices to
rearrange them, clicking pairs of vertices to add/delete edges, etc.
I think I've seen interest in something similar for use with geometry
objects.
So in choosing a tool that allows interaction with graphics in the
notebook, it'd be nice if it was powerful, or flexible, enough to
support the creation of various data structures by clicking, dragging,
etc on a canvas.
Rob
Jason Grout
Mike Hansen played with doing graphs in SVG a while back and had a nice
little javascript thing that let you drag vertices around. That's
something that is immediately usable, but it didn't do graph creation.
That seems just a bit harder (i.e., Mike's thing is an output thing that
doesn't have to communicate back with Sage, while what you are proposing
is an alternative input mechanism to Sage).
Jason
Kenny
bode diagram plotted into a popup. It is good looking and we would
like
to shere this code with the community.
Is anybode there that feels like to help us posting it in a publi
visible server?
We don't have a trac account and I would like to avoid opening ticket.
Thx.. Rob (aka Kenny)
mabshoff
On Feb 24, 5:14 am, Kenny <masso.ke...@gmail.com> wrote:
> I've worked with Maurizio and we came out with a working example of a
> bode diagram plotted into a popup. It is good looking and we would
> like
> to shere this code with the community.
>
> Is anybode there that feels like to help us posting it in a publi
> visible server?
Then create a worksheet demoing it and publish it. I am not 100%
certain this will work, but if it does it should be convenient. Once
you verified that is works and the publishing does not break it post a
link here.
> We don't have a trac account and I would like to avoid opening ticket.
>
> Thx.. Rob (aka Kenny)
Michael

kcrisman
the notebook and matplotlib for the command line, some combination of
the above, or neither? Also, what are things matplotlib can do that
something like FLOT couldn't (I assume there are a lot of them)? I
ask out of ignorance.
- kcrisman
Jason Grout
I think having a viewer='flot' would work well, so that you would do:
p=plot(x^2, (x,0,10))
show(p, viewer='flot')
Jason
kcrisman
>
> p=plot(x^2, (x,0,10))
> show(p, viewer='flot')
notebook or both or neither or just in interacts or... - and what
functionality would be *lost* in that event? I'm just trying to get a
sense of this, because I am not conversant with the technical merits
on either side. Sorry to be pesty about it.
- kcrisman
Jason Grout
(speaking for myself) I think for right now, we aren't considering it
being default, at least until we see it. However, we do eventually want
to have some sort of nice plotting be default in the notebook, but at
the same time we don't want to give up all of the nice powerful plotting
that is available currently through matplotlib.
I see it eventually as an option someone could give to show, just like
now we can do show(..., viewer='tachyon') and get a raytraced image.
Since it is javascript, I think it would only make sense in the notebook.
So:
* not default, but we may consider it if it could replace the
functionality of matplotlib
* only for the notebook
That's my take, anyway.
Jason
Kenny
http://sagenb.org/home/pub/285/
this is the public worksheet. It launch a popup windows so pls enable
popup to see it working. I tested it under Firefox and google chrome.
It does NOT work with IE, think the bug is in the excanvas.js or
something
similar. Nothing that cannot be fixed.
Select an area to interact with the graph. If you hover with the mouse
on the data series you'll get a tip showing the values of the data.
The x axis shows only the exponent of the base 10 of the log scale.
This
far from perfect :) but it looks pretty and enable user interaction
with the
graph.
Hope some developer find it interesting and star working with us on
this!
Bye Rob.
Maurizio
as you can see, Kenny and me have finished working on this and
uploading it onto a public notebook.
Please, consider this just a draft, we would really like to get the
community interested in it, so that we can all work together on this,
if it is considered useful.
In our opinion, this should no way be considered a replacement for
matplotlib. On the contrary, this should be a useful option (maybe
enabled by default in the notebook, if that can make sense), to get
(together with a nice matplotlib png) a popup window (this is the way
it's currently done, but otherwise if the notebook code can be
modified, this can be even embedded) with a good looking and
interactive plot.
Having said that, even though we just implemented a bode plot, going
through all the different flot plot capabilities is matter of time
(not too much, in my opinion), so that we can get the optional
"interactive plot" for all the supported types. I think that if we
show a considerable interest, the flot developers could consider
helping us in implementing the desired features, with a win-win
strategy.
At present, the way to make the flot plot to show up, in our function,
is to append: "flot = 1" at the end of the bode() options.
Have fun!!!
Maurizio

William Stein
That demo is stunningly gorgeous.
William
kcrisman
may have done something wrong. I get a link to plotWin.html which has
labeling but no actual plots. The plots look nice, though!
By the way, how does one zoom *out* using flot? That is just as
important, esp. once one has zoomed in at a wrong place.
- kcrisman
Jason Grout
I agree. It's beautiful and functional. Good job!
Jason
Jason Grout
> I see the "canvas" backend to matplotlib being just like the FLOT tool
> (indeed, maybe one could even use the FLOT library to do it!). The
> matplotlib backend just needs to be able to draw some basic shapes (like
> lines and text) and provide some sort of interface for interaction. All
> of this should be documented in the matplotlib docs and/or code, and
> help is available on the matplotlib list.
>
> That said, I haven't actually developed a matplotlib backend. If one
> were interested in working on a canvas (or even a FLOT) backend to
> matplotlib, it would probably be best to take things to the matplotlib list.
I posted a message to the matplotlib-devel list, and the reply is here:
Jason
Maurizio
thank you very much, I consider your appreciation a very valuable
goal.
As you can see, the potential is there. The plot looks modern and easy
to browse. As for myself, this certainly fills a big lack (together
with the linear plot, which is even easier to deal with).
In my opinion, SAGE's notebook is the real killer feature, which I
don't recall to have seen in any other (commercial or not) software. I
mean, this is the only scientific program that I've found, allowing
such an easy collaborative job within local networks, something that
is not comparable to any kind of subversioning software or stuff like
that. The only idea that I can access my data from abroad (if needed)
by setting up a SAGE server makes me happy. Moreover, the nice
interface is valuable as well, like the presentation of results in
latex format.
I know that interfaces are not really scientists' job, but having a
good one is a real step ahead. And plot interactivity is a one million
dollar feature for people who deal with design and system performance
evaluation.
Maurizio
Maurizio
original zoom. I know this is not really what you were looking for,
but for the first time, it should be more than enough ;)
I have no Mac, so I can't test it on Safari, sorry
Maurizio
Tom Boothby
I think I saw this in one of the FLOT examples.
William Stein
>
> It shouldn't be hard to implement a double-click to zoom to original.
> I think I saw this in one of the FLOT examples.
iphone, and who would know to double click unless they read the docs.
I agree that any of this shouldn't be hard.
> On Tue, Feb 24, 2009 at 12:43 PM, Maurizio <maurizio...@gmail.com> wrote:
>>
>> Well, we honestly just hit F5 (that is reload in Firefox) to get the
>> original zoom. I know this is not really what you were looking for,
>> but for the first time, it should be more than enough ;)
>>
>> I have no Mac, so I can't test it on Safari, sorry
>>
>> Maurizio
>>
>> On 24 Feb, 20:02, kcrisman <kcris...@gmail.com> wrote:
>>> Just FYI this does not appear to work (the popup) in Safari, though I
>>> may have done something wrong. I get a link to plotWin.html which has
>>> labeling but no actual plots. The plots look nice, though!
>>>
>>> By the way, how does one zoom *out* using flot? That is just as
>>> important, esp. once one has zoomed in at a wrong place.
>>>
>>> - kcrisman
>> >
>>
>
> >
>
William Stein
Associate Professor of Mathematics
University of Washington
http://wstein.org

Dan Drake
> I've done as you told me...
>
> http://sagenb.org/home/pub/285/
>
> this is the public worksheet. It launch a popup windows so pls enable
> popup to see it working. I tested it under Firefox and google chrome.
> It does NOT work with IE, think the bug is in the excanvas.js or
> something similar. Nothing that cannot be fixed.
>
> Select an area to interact with the graph. If you hover with the mouse
> on the data series you'll get a tip showing the values of the data.
>
> The x axis shows only the exponent of the base 10 of the log scale.
> This far from perfect :) but it looks pretty and enable user
> interaction with the graph.
Wow! That is awesome!
I would love to have that kind of plotting available to me in Sage.
Dan
--
--- Dan Drake <dr...@kaist.edu>
----- KAIST Department of Mathematical Sciences
------- http://mathsci.kaist.ac.kr/~drake
Tom Boothby
this -- I think it's pretty awesome:
1) apply http://sage.math.washington.edu/home/boothby/timer.patch
2) upload jquery.flot_r135.js into the data directory of a worksheet
3) paste the attached into a worksheet (in edit mode)
4) Press "start"
Currently, changing more than one @interact widget at a time
"forgets", everything but the first. So, to play with the slider while
the timer is running, you might have to change the "t=timer(1000)" in
the @interact to "t=timer(2000)" or bigger, depending on processor
speed / network latency.
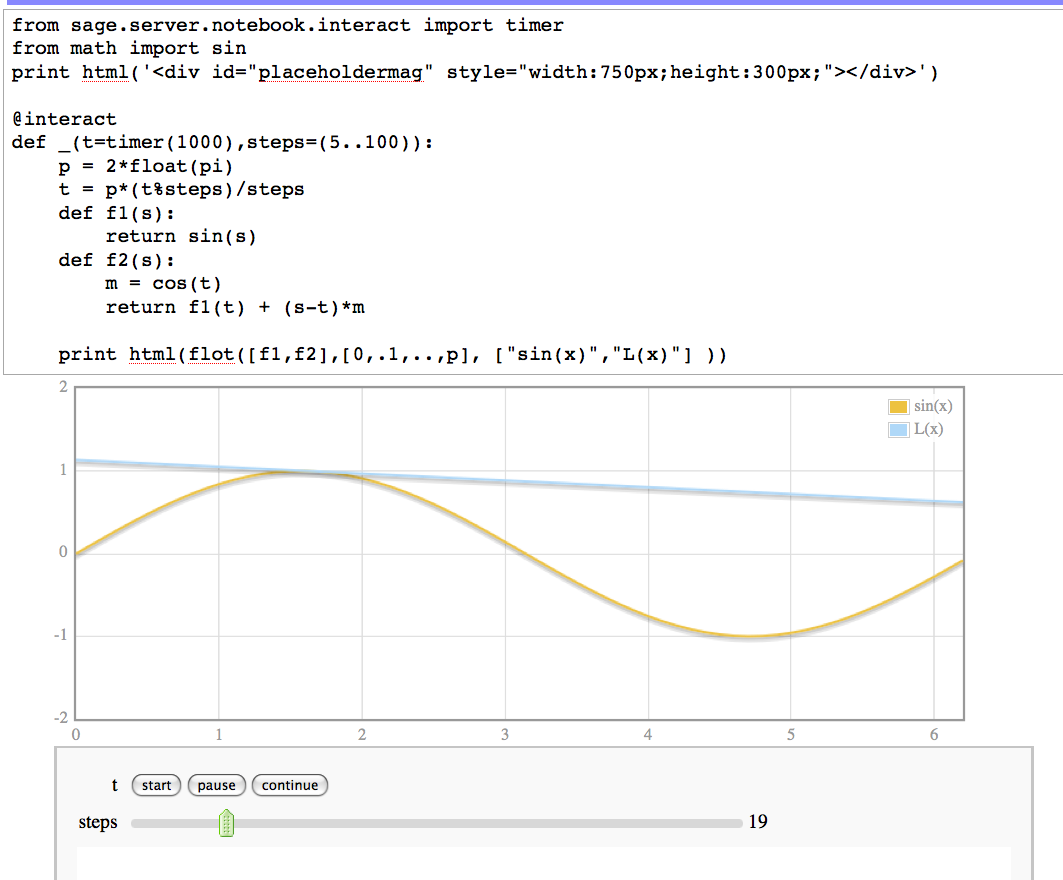
William Stein
along the curve. Drag the slider to control how smoothly it moves
(how many steps).
William
>
> >
>
>
> {{{id=0|
> def flot(F,x,L):
> d = []
>
> for f in F:
> d.append([f(t) for t in x])
> return "<script>setTimeout(%r)</script>"%flotData(x,d,L)
>
> def flotData(xdata, Y, L):
>
> s = 'var splot = ['
> s+= ",".join(['{ data:'+str([[a,b] for a,b in zip(xdata,ydata)])+',label: "'+l+'"}' for ydata,l in zip(Y,L)])
> s+= '];'
>
> s+= r"""
>
> var options1 = {
> crosshair: { mode: "xy", color: "#ff0000" },
> lines: { show: true },
> xaxis: { ticks: 6 },
> yaxis: { ticks: 4, tickDecimals: 0, min: -2, max:2 },
> selection: { mode: "xy" },
> grid: { hoverable: true, clickable: true , color: "#999"}
> };
>
> var placeholdermag = \$("#placeholdermag");
> var plotm = \$.plot(placeholdermag, splot, options1);
> """
> return s
> ///
> }}}
>
> {{{id=4|
> html("<script src='data/jquery.flot_r135.js'></script>")
> }}}
>
> {{{id=1|
> from sage.server.notebook.interact import timer
> from math import sin
> print html('<div id="placeholdermag" style="width:750px;height:300px;"></div>')
>
> @interact
> def _(t=timer(1000),steps=(5..100)):
> p = 2*float(pi)
> t = p*(t%steps)/steps
> def f1(s):
> return sin(s)
> def f2(s):
> m = cos(t)
> return f1(t) + (s-t)*m
>
> print html(flot([f1,f2],[0,.1,..,p], ["sin(x)","L(x)"] ))
Tom Boothby
because when one changes the contents of the interact, it's choppy.
However, if you do all your work in the fixed size div, there's no
choppiness at all, it just suddenly changes. No flashing, no jumping,
no nothing. To get this to be usable, we'll need to make it so plots
are somehow registered with the interact. Ideas? I'm not sure how to
do this.
kcrisman
> I have no Mac, so I can't test it on Safari, sorry
- kcrisman
Maurizio

Tim Lahey
On Feb 24, 2009, at 12:11 PM, Kenny wrote:
>
> I've done as you told me...
>
> http://sagenb.org/home/pub/285/
>
> this is the public worksheet. It launch a popup windows so pls enable
> popup to see it working. I tested it under Firefox and google chrome.
> It does NOT work with IE, think the bug is in the excanvas.js or
> something
> similar. Nothing that cannot be fixed.
>
> Select an area to interact with the graph. If you hover with the mouse
> on the data series you'll get a tip showing the values of the data.
>
> The x axis shows only the exponent of the base 10 of the log scale.
> This
> far from perfect :) but it looks pretty and enable user interaction
> with the
> graph.
>
> Hope some developer find it interesting and star working with us on
> this!
>
> Bye Rob.
>
I really like this overall, but I found that it's kind of hit and miss
with respect to showing points on the graphs. I'd like to get the point
at the intersection of two lines, but I can't seem to get it to show me
the point. This is using Safari 3.2.1.
Cheers,
Tim.
kcrisman
On Feb 24, 8:42 pm, Tom Boothby <tomas.boot...@gmail.com> wrote:
> I should point out that the div is *outside* of the interact. This is
> because when one changes the contents of the interact, it's choppy.
> However, if you do all your work in the fixed size div, there's no
> choppiness at all, it just suddenly changes. No flashing, no jumping,
is pretty annoying, so any final implementation might want to address
that. Also, for some reason I had to do
html("<script src=DATA+'jquery.flot.js'></script>")
instead of the data/jquery... thing in the original worksheet code Tom
posted. (flot.js not flot_rxxx.js because that was the only one I
easily could download, and it does work).
> no nothing. To get this to be usable, we'll need to make it so plots
> are somehow registered with the interact. Ideas? I'm not sure how to
> do this.
polished; great work!
- kcrisman
Maurizio
the tooltips are being showed only where the data points are provided,
and no interpolation is provided for intermediate points.
I don't know if I would really require that feature, because this is
supposed just to show the data we provide, not necessarily any more.
Moreover, basically MATLAB basically does the same with a given
accuracy (automatically evaluated, when you do the bode plots, or
manually given, when you do data plot).
At the very end, you can easily increase the number of points using
the "steps_decade" parameter to the function (20 is the default number
of points per decade)
Maurizio