[Fwd: Monckton's Lecture]

John Russell
<http://www.youtube.com/watch?v=32KOg4yB22Q&feature=player_embedded>

It's taken a long time so I'm not going to go any further. I did it because a friend of mine (also called John), with whom I have had many heated arguments over the subject of Climate Change, challenged me to prove the science wrong. His 'science' -- surprise, surprise -- turned out to be no more than a recent lecture by Monckton, which he seemed to lap up as gospel. As I don't want the work I put in to be effort totally wasted on a sceptic (a sceptic who I think is more a denier than he admits), I offer it here. It's been quite good fun to
do; I hope others enjoy reading it.
If anyone spots an error please let me know. Also please excuse the personalisation: I've wasted enough time without rewriting it for Monbiot!
Kind regards,
John
John Russell
Lower Winsford Farm
Devon, UK
* *
Email to a friend.
John,
Here is my refuting of the first part of Monkton's arguments.
In his
introduction he makes a sneering play on the science being ‘blindingly
obvious’, but
unfortunately that appears to be his problem. In life often the most
obvious
explanation is often not where 'the truth' lies. In scientific terms to
accept the ‘blindingly
obvious’ is a major error. For millennia was it not ‘blindingly
obvious’ to
humanity that the Earth was flat?
I have dealt with Monckton's arguments in the order he makes them and
have put
the timing of each argument before my response so that you can see
where it
comes from.
1) Part 1 @ 3:03. "We see a falling trend in global temperature between
January 2001 and July 2009"
His graph only covers seven and a half years and the cooling trend is
0.1C
That's one tenth of a degree in seven and a half years. That's like
saying that
Crich is lower than Holloway because the last hundred yards of road
between the
tramway museum and the chip shop are downhill.
To see the extent of his chicanery, one needs only plot the actual IPCC projections against the observations. This can be done a number of ways; firstly, plotting the observational data and the models used by IPCC with a common baseline of 1980-1999 temperatures (as done in the 2007 report) (Note that the model output is for the annual mean, monthly variance would be larger):


These show clearly that 2002-2009 is way too short a period for the trends to be meaningful and that Monckton’s estimate of what the IPCC projects for the current period is woefully wrong. Not just wrong; fake. Even if one assumes that the baseline should be the year 2002 making no allowance for internal variability (which makes no sense whatsoever), you would get the following graph:
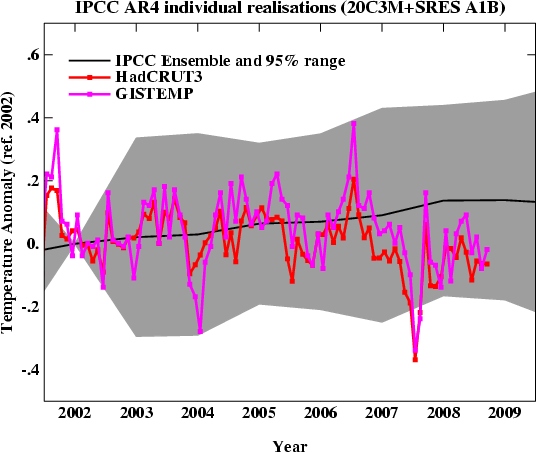
- still nothing like Monckton showed. Instead, he appears to have derived his ‘projections’ by drawing a line from 2002 to a selection of real projections in 2100 and ignoring the fact that the actual projections accelerate as time goes on, and thus strongly over-estimating the projected changes that are expected now (see here). In summary, Monkton's first evidence has been contrived by distorting the graphs.
2) Part 1
@ 3:22. "Arctic sea Ice is back to normal levels in 2008 & 2009."
As 2007 was the largest shrinking of Arctic ice since records began,
the odds
were that the following two years wouldn't be as bad. Monckton has done
the
same here as he did for global temperature. He's just taken the last
two years
and extrapolated a trend from it. That's like saying Monday was sunny
but it's
rained ever since then -- so that means it will never be sunny again.
The following graph, produced by University of Boulder, USA, shows the actual trend.
Note that the observations to date are running well short of the models: that is, it’s worse than predicted.
3) Part 1 @ 4:16. "Antarctic Sea Ice is increasing."
This is akin to saying, "it rained in
London all day today, therefore today it rained everywhere ".
Monckton's
statement is true but crucially it's only half the story -- the half
that
supports his argument.
The facts are that...
Antarctic land ice is decreasing at an accelerating rate
Antarctic sea ice is increasing despite the warming Southern Ocean.
So why is Antarctic sea ice increasing at the same time as the sea temperature is increasing? Sometimes following the ‘blindingly obvious’ can send us up the garden path. The answer seems to me to be a good example of why climate science should be solely the province of climate scientists. First, the graphs.
Surface air temperature over the ice-covered areas of the Southern Ocean (top). Sea ice extent, observed by satellite (bottom). (Zhang 2007)
Surely warmer water would result in less ice forming? There are several contributing factors. One is the drop in ozone levels over Antarctica. The hole in the ozone layer above the South Pole has caused cooling in the stratosphere (Gillet 2003). This strengthens the cyclonic winds that circle the Antarctic continent (Thompson 2002). The wind pushes sea ice around, creating areas of open water known as polynyas. More polynyas leads to increased sea ice production (Turner 2009).
Another contributor is changes in ocean circulation. The Southern Ocean consists of a layer of cold water near the surface and a layer of warmer water below. Water from the warmer layer rises up to the surface, melting sea ice. However, as air temperatures warm, the amount of rain and snowfall also increases. This freshens the surface waters. So now you have a surface layer that is less dense than the saltier, warmer water below. The layers become more stratified and mix less. Less heat is transported upwards from the deeper, warmer layer. Hence less sea ice is melted (Zhang 2007).
The bottom line is that Antarctic sea ice is a complex and unique phenomenon. The simplistic interpretation that it must be cooling around Antarctica is decidedly not the case. By choosing to use only the second of the two graphs Monckton distorts the research findings.
4) Part 1 @ 4:33. “The area of global sea ice remains static”
I’ve already shown that Arctic sea ice is reducing (see graph above at 2). I’ve also agreed that Antarctic sea ice is increasing and explained why that should be so when at the same time the sea is warming and land ice is reducing (see 3 above). If one averages out the increasing Antarctic sea ice and the decreasing Arctic sea ice the resultant is the very slight overall global decrease which can be seen on Monckton’s graph from National Center for Environmental Prediction/NOAA
Below is a graph which demonstrates precisely what I’m saying.
This graph can be found here: http://nsidc.org/sotc/sea_ice.html
We should also bear in mind that area is not mass. Several studies have shown that sea ice is in fact thinning.
http://www.nature.com/nature/journal/v461/n7266/full/nature08471.html
5) Part 1 @ 4:47. “Greenland Ice sheet is thickening at 5cm per annum”
The statement appears to be true, in so far as some areas of ice in Greenland are gaining in thickness. However that’s because warmer temperatures cause more snow to fall in Greenland's interior.
The NASA article Greenland's Ice Island Alarm looks at the difficulties of measuring ice loss in Greenland and how different techniques using different data (eg - satellites measuring gravity or surface height changes) all agree that, overall, Greenland is losing between 150 and 180 gigatonnes of ice per year.
6) Part 1 @ 5:12. “Radar station is engulfed by ice.”
See the answer to 5).
We should also bear in mind that the radar stations are built on ice that could be hundreds of metres thick (see captions on Monckton's slide). One would presume that softer surface snow and ice were removed before the structures were erected on more solid ice below. One would therefore expect the snow to blow back to some degree. Snow also drifts round objects. Also ice compresses as it accumulates and therefore one might expect some sinking of the structure as the ice under the radar stations compresses further with time. I can’t prove these points; it’s just my conjecture.
7) Part 1 @ 5:35. “Eurasian snow cover is just fine.”
It took me a while to dig out relevant research on this one. I can’t find a reliable reference to Monckton’s graph; however I did find the following research carried out by the Bigelow Laboratory which seems at odds with Monckton’s graph.
Departures from monthly means of % snow cover extent over Southwest Asia (SWA) and Himalayas-Tibetan Plateau (HTP) between 1967 and 2003. Note especially the runaway decline in snow cover extent after 1997.
“Over the past 7 years, the western half of the Arabian Sea has witnessed record increases in phytoplankton blooms due to a year-by-year intensification of monsoonal winds. In a recent study that has appeared in the journal Science (22 April 2005, Vol. 308), we show that these changes are being triggered by the rapid decline and meltdown of winter-time snow over southwest Asia and the Himalayas.”
Also see: http://www.nasa.gov/vision/earth/lookingatearth/eurasian_melt.html
8) Part 1 @ 5:55. “Hurricanes have not increased”
Monckton is tilting at windmills here.
Some environmentalists have conjectured for a long time that warming might increase the frequency and/or severity of hurricanes and other extreme weather events. However, no scientific data has ever been put forward to show, conclusively, a link between global warming and increasing hurricanes. Consequently Monckton’s is a non argument.
9) Part 1 @ 6:25. “Coral reefs are not being destroyed by global warming”.
Monckton’s argument that the corals of the Great Barrier Reef are not being destroyed by global warming revolves round the fact that sea temperatures in the area have not risen. This is obfuscation of the highest order.
A major contributor to the bleaching events is ocean acidification, and that acidification occurs because of the rising CO2 in the atmosphere which in turn is being absorbed by the oceans worldwide. OK, so even if we ignore global warming as a cause of coral loss, acidification is a cause; and both the current warming and acidification are a result of humans burning fossil fuels -- which is what all the fuss is about, is it not?
http://www.aims.gov.au/docs/research/climate-change/declining-coral-growth.html
“Recent work by scientists at the Australian Institute of Marine Science (AIMS) has identified a wide-spread and rapid decline in the growth rate of massive Porites coral colonies on the Great Barrier Reef. A systematic analysis of potential causes suggests that a combination of rising sea surface temperature and ocean acidification, due to increased carbon dioxide (CO2) in the atmosphere, is likely to be the cause of this dramatically slowed growth.”
10) Part 1 @ 8:30. “CRU Emails: all the leading climate scientists are crooks”
This has been so well refuted that there’s no point in regurgitating it. Assigning motives to the originators of the emails is not ‘scientific evidence’ as such. The stolen emails were private communications between like-minded people, so of course they reveal unrestrained language between scientists who were clearly annoyed by the activities of those seeking to undermine their work .
The
key point is that even if the few supposedly incriminating
emails out of the thousands sent between the six or so key scientists
show that
they have been dishonest (which I ‘m not saying and don’t believe), it
has no
relevance to the many tens of thousands of other 'leading climate
scientists' around the
world whose emails were not stolen and who all accept the evidence
embodied in
the data; that humans are changing the world’s climate.
*
In conclusion, in part one I have found nothing in Monckton’s self-proclaimed ‘blindingly obvious’ science to convince me that he has anything relevant to contribute. On the contrary I find him deceitful and devious. If he knows what he is doing he’s a charlatan: if he doesn’t then he’s a simpleton. I lean towards the former.
I’ve watched the other parts but – as it’s taken me quite a while to dig out the evidence to refute this lot – on the grounds that I’ve proved it’s a waste of my time to take Monckton’s ‘science’ seriously, I don’t wish to delve any further.
You know, if one is a true sceptic one should do what I have done here with every blindingly obvious ‘statement of fact’ made by a pundit anywhere. It can quite quickly confirm or refute the argument and enable us to decide that ‘A’ is a genuine ‘seeker of the truth’, while ‘B’ is an arsehole. I wasn’t 100% sure before, but now I am. I am confident that Monckton is an arsehole.
I hope you appreciate the time I have put into this and I await your response to my critique with interest. I'm completely open to persuasion, as I hope you are. And, I agree, let’s stick to the science.
Best wishes,
John

Duncan Hewitt
Well after a lot of effort I've managed to complete my refuting of the first part of Monckton's lecture.
<http://www.youtube.com/watch?v=32KOg4yB22Q&feature=player_embedded>

It's taken a long time so I'm not going to go any further. I did it because a friend of mine (also called John), with whom I have had many heated arguments over the subject of Climate Change, challenged me to prove the science wrong. His 'science' -- surprise, surprise -- turned out to be no more than a recent lecture by Monckton, which he seemed to lap up as gospel. As I don't want the work I put in to be effort totally wasted on a sceptic (a sceptic who I think is more a denier than he admits), I offer it here. It's been quite good fun to
do; I hope others enjoy reading it.
If anyone spots an error please let me know. Also please excuse the personalisation: I've wasted enough time without rewriting it for Monbiot!
Kind regards,
John
John Russell
Lower Winsford Farm
Devon, UK
* *
Email to a friend.John,
Here is my refuting of the first part of Monkton's arguments.In his introduction he makes a sneering play on the science being ‘blindingly obvious’, but unfortunately that appears to be his problem. In life often the most obvious explanation is often not where 'the truth' lies. In scientific terms to accept the ‘blindingly obvious’ is a major error. For millennia was it not ‘blindingly obvious’ to humanity that the Earth was flat?
I have dealt with Monckton's arguments in the order he makes them and have put the timing of each argument before my response so that you can see where it comes from.
1) Part 1 @ 3:03. "We see a falling trend in global temperature between January 2001 and July 2009"
His graph only covers seven and a half years and the cooling trend is 0.1C That's one tenth of a degree in seven and a half years. That's like saying that Crich is lower than Holloway because the last hundred yards of road between the tramway museum and the chip shop are downhill.To see the extent of his chicanery, one needs only plot the actual IPCC projections against the observations. This can be done a number of ways; firstly, plotting the observational data and the models used by IPCC with a common baseline of 1980-1999 temperatures (as done in the 2007 report) (Note that the model output is for the annual mean, monthly variance would be larger):
These show clearly that 2002-2009 is way too short a period for the trends to be meaningful and that Monckton’s estimate of what the IPCC projects for the current period is woefully wrong. Not just wrong; fake. Even if one assumes that the baseline should be the year 2002 making no allowance for internal variability (which makes no sense whatsoever), you would get the following graph:
- still nothing like Monckton showed. Instead, he appears to have derived his ‘projections’ by drawing a line from 2002 to a selection of real projections in 2100 and ignoring the fact that the actual projections accelerate as time goes on, and thus strongly over-estimating the projected changes that are expected now (see here). In summary, Monkton's first evidence has been contrived by distorting the graphs.
2) Part 1 @ 3:22. "Arctic sea Ice is back to normal levels in 2008 & 2009."
As 2007 was the largest shrinking of Arctic ice since records began, the odds were that the following two years wouldn't be as bad. Monckton has done the same here as he did for global temperature. He's just taken the last two years and extrapolated a trend from it. That's like saying Monday was sunny but it's rained ever since then -- so that means it will never be sunny again.The following graph, produced by University of Boulder, USA, shows the actual trend.
<mime-attachment.jpeg>
Note that the observations to date are running well short of the models: that is, it’s worse than predicted.
3) Part 1 @ 4:16. "Antarctic Sea Ice is increasing."
This is akin to saying, "it rained in London all day today, therefore today it rained everywhere ". Monckton's statement is true but crucially it's only half the story -- the half that supports his argument.The facts are that...
Antarctic land ice is decreasing at an accelerating rate
Antarctic sea ice is increasing despite the warming Southern Ocean.
So why is Antarctic sea ice increasing at the same time as the sea temperature is increasing? Sometimes following the ‘blindingly obvious’ can send us up the garden path. The answer seems to me to be a good example of why climate science should be solely the province of climate scientists. First, the graphs.
<mime-attachment.jpeg>
Surface air temperature over the ice-covered areas of the Southern Ocean (top). Sea ice extent, observed by satellite (bottom). (Zhang 2007)
Surely warmer water would result in less ice forming? There are several contributing factors. One is the drop in ozone levels over Antarctica. The hole in the ozone layer above the South Pole has caused cooling in the stratosphere (Gillet 2003). This strengthens the cyclonic winds that circle the Antarctic continent (Thompson 2002). The wind pushes sea ice around, creating areas of open water known as polynyas. More polynyas leads to increased sea ice production (Turner 2009).
Another contributor is changes in ocean circulation. The Southern Ocean consists of a layer of cold water near the surface and a layer of warmer water below. Water from the warmer layer rises up to the surface, melting sea ice. However, as air temperatures warm, the amount of rain and snowfall also increases. This freshens the surface waters. So now you have a surface layer that is less dense than the saltier, warmer water below. The layers become more stratified and mix less. Less heat is transported upwards from the deeper, warmer layer. Hence less sea ice is melted (Zhang 2007).
The bottom line is that Antarctic sea ice is a complex and unique phenomenon. The simplistic interpretation that it must be cooling around Antarctica is decidedly not the case. By choosing to use only the second of the two graphs Monckton distorts the research findings.
4) Part 1 @ 4:33. “The area of global sea ice remains static”
I’ve already shown that Arctic sea ice is reducing (see graph above at 2). I’ve also agreed that Antarctic sea ice is increasing and explained why that should be so when at the same time the sea is warming and land ice is reducing (see 3 above). If one averages out the increasing Antarctic sea ice and the decreasing Arctic sea ice the resultant is the very slight overall global decrease which can be seen on Monckton’s graph from National Center for Environmental Prediction/NOAA
<mime-attachment.jpeg>
Below is a graph which demonstrates precisely what I’m saying.
<mime-attachment.jpeg>
This graph can be found here: http://nsidc.org/sotc/sea_ice.html
We should also bear in mind that area is not mass. Several studies have shown that sea ice is in fact thinning.
http://www.nature.com/nature/journal/v461/n7266/full/nature08471.html
5) Part 1 @ 4:47. “Greenland Ice sheet is thickening at 5cm per annum”
The statement appears to be true, in so far as some areas of ice in Greenland are gaining in thickness. However that’s because warmer temperatures cause more snow to fall in Greenland's interior.
The NASA article Greenland's Ice Island Alarm looks at the difficulties of measuring ice loss in Greenland and how different techniques using different data (eg - satellites measuring gravity or surface height changes) all agree that, overall, Greenland is losing between 150 and 180 gigatonnes of ice per year.
6) Part 1 @ 5:12. “Radar station is engulfed by ice.”
See the answer to 5).
We should also bear in mind that the radar stations are built on ice that could be hundreds of metres thick (see captions on Monckton's slide). One would presume that softer surface snow and ice were removed before the structures were erected on more solid ice below. One would therefore expect the snow to blow back to some degree. Snow also drifts round objects. Also ice compresses as it accumulates and therefore one might expect some sinking of the structure as the ice under the radar stations compresses further with time. I can’t prove these points; it’s just my conjecture.
7) Part 1 @ 5:35. “Eurasian snow cover is just fine.”
It took me a while to dig out relevant research on this one. I can’t find a reliable reference to Monckton’s graph; however I did find the following research carried out by the Bigelow Laboratory which seems at odds with Monckton’s graph.
<mime-attachment.jpeg>
Departures from monthly means of % snow cover extent over Southwest Asia (SWA) and Himalayas-Tibetan Plateau (HTP) between 1967 and 2003. Note especially the runaway decline in snow cover extent after 1997.
“Over the past 7 years, the western half of the Arabian Sea has witnessed record increases in phytoplankton blooms due to a year-by-year intensification of monsoonal winds. In a recent study that has appeared in the journal Science (22 April 2005, Vol. 308), we show that these changes are being triggered by the rapid decline and meltdown of winter-time snow over southwest Asia and the Himalayas.”
Also see: http://www.nasa.gov/vision/earth/lookingatearth/eurasian_melt.html
8) Part 1 @ 5:55. “Hurricanes have not increased”
Monckton is tilting at windmills here.
Some environmentalists have conjectured for a long time that warming might increase the frequency and/or severity of hurricanes and other extreme weather events. However, no scientific data has ever been put forward to show, conclusively, a link between global warming and increasing hurricanes. Consequently Monckton’s is a non argument.
9) Part 1 @ 6:25. “Coral reefs are not being destroyed by global warming”.
Monckton’s argument that the corals of the Great Barrier Reef are not being destroyed by global warming revolves round the fact that sea temperatures in the area have not risen. This is obfuscation of the highest order.
A major contributor to the bleaching events is ocean acidification, and that acidification occurs because of the rising CO2 in the atmosphere which in turn is being absorbed by the oceans worldwide. OK, so even if we ignore global warming as a cause of coral loss, acidification is a cause; and both the current warming and acidification are a result of humans burning fossil fuels -- which is what all the fuss is about, is it not?
http://www.aims.gov.au/docs/research/climate-change/declining-coral-growth.html
“Recent work by scientists at the Australian Institute of Marine Science (AIMS) has identified a wide-spread and rapid decline in the growth rate of massive Porites coral colonies on the Great Barrier Reef. A systematic analysis of potential causes suggests that a combination of rising sea surface temperature and ocean acidification, due to increased carbon dioxide (CO2) in the atmosphere, is likely to be the cause of this dramatically slowed growth.”
10) Part 1 @ 8:30. “CRU Emails: all the leading climate scientists are crooks”
This has been so well refuted that there’s no point in regurgitating it. Assigning motives to the originators of the emails is not ‘scientific evidence’ as such. The stolen emails were private communications between like-minded people, so of course they reveal unrestrained language between scientists who were clearly annoyed by the activities of those seeking to undermine their work .
The key point is that even if the few supposedly incriminating emails out of the thousands sent between the six or so key scientists show that they have been dishonest (which I ‘m not saying and don’t believe), it has no relevance to the many tens of thousands of other 'leading climate scientists' around the world whose emails were not stolen and who all accept the evidence embodied in the data; that humans are changing the world’s climate.
*
In conclusion, in part one I have found nothing in Monckton’s self-proclaimed ‘blindingly obvious’ science to convince me that he has anything relevant to contribute. On the contrary I find him deceitful and devious. If he knows what he is doing he’s a charlatan: if he doesn’t then he’s a simpleton. I lean towards the former.
I’ve watched the other parts but – as it’s taken me quite a while to dig out the evidence to refute this lot – on the grounds that I’ve proved it’s a waste of my time to take Monckton’s ‘science’ seriously, I don’t wish to delve any further.
You know, if one is a true sceptic one should do what I have done here with every blindingly obvious ‘statement of fact’ made by a pundit anywhere. It can quite quickly confirm or refute the argument and enable us to decide that ‘A’ is a genuine ‘seeker of the truth’, while ‘B’ is an arsehole. I wasn’t 100% sure before, but now I am. I am confident that Monckton is an arsehole.
I hope you appreciate the time I have put into this and I await your response to my critique with interest. I'm completely open to persuasion, as I hope you are. And, I agree, let’s stick to the science.
Best wishes,
John
--
--
You received this message because you are subscribed to the Google Groups "Monbiot Discussions" group.
To post to this group, send email to monbiot...@googlegroups.com.
To unsubscribe from this group, send email to monbiot-discu...@googlegroups.com.
For more options, visit this group at http://groups.google.com/group/monbiot-discuss?hl=en.

V Wood
Best
V
Date: Fri, 18 Dec 2009 10:23:11 +0000
From: j...@johnrussell.tv
To: monbiot...@googlegroups.com
Subject: [Monbiot] [Fwd: Monckton's Lecture]
John Russell
I'll let you know how my friend reacts. I'm guessing he'll side-step my refutation of Monckton's 'science' and come back with a whole new set of cherry-picked unconnected 'arguments'. Taking a leaf out of monbiot, I'll be saying, "answer the question!".
Best wishes,
JR

Joan Sutherland
--
You received this message because you are subscribed to the Google Groups "Monbiot Discussions" group.
To post to this group, send email to monbiot...@googlegroups.com.
To unsubscribe from this group, send email to monbiot-discu...@googlegroups.com.
For more options, visit this group at http://groups.google.com/group/monbiot-discuss?hl=en.
--
Joan
------
Joan Sutherland
Allegra Strings
"classical music for classy events since 1992"
man...@allegrastrings.com
www.allegrastrings.com
Kingston, ON
613.329.1763

Lila Smith
www.windwand.co.nz
Taranaki Tourism Website
www.windwand.co.nz/organickitchengarden.htm
Organic Kitchen Gardening
Mob 021230 7962
06 7512942
122 Ngamotu Road
New Plymouth
New Zealand
No virus found in this incoming message.
Checked by AVG - www.avg.com
Version: 8.5.427 / Virus Database: 270.14.112/2571 - Release Date: 12/17/09 19:40:00
V Wood
It is in the email trail below. Go all the way to the bottom.
Best
V
From: lil...@ihug.co.nz
To: monbiot...@googlegroups.com
Subject: Re: [Monbiot] [Fwd: Monckton's Lecture]
Date: Sat, 19 Dec 2009 09:32:41 +1300