LCROSS Team report schedule

cano...@yahoo.com
-----
LCROSS Lunar Impactor Mission The LCROSS science team met on Saturday
and Monday to discuss the results and start putting together the
story. In addition, further reports came in from the EBOC (Earth Based
Observational Campaign). As true to the scientific method, data has
been g...athered, positive & null results are both valuable. Now is
the time for analysis and comparisons with theory to explain the
story. The team anticipates to report at the LEAG in Houston coming up
in a few weeks and at the AGU in San Francisco in December. Meanwhile,
check our mission page http://www.nasa.gov/lcross for the latest
updates.-LCROSS Facebook Team
http://www.facebook.com/pages/LCROSS-Lunar-Impactor-Mission/154478180006
-----
cano...@yahoo.com
LCROSS Team impact analysis status update - press release
10-16-2009
http://www.nasa.gov/mission_pages/LCROSS/main/LCROSS_impact.html
LCROSS Impact images page
http://www.nasa.gov/mission_pages/LCROSS/main/LCROSS_impact_images.html
cano...@yahoo.com
Chat with LCROSS PI Tony Colaprete at the MyMoon Webcast on Wednesday,
October 21 at 8 pm EDT: http://nasa-nai.acrobat.com/colaprete
cano...@yahoo.com
From the LCROSS Facebook page
10-27-2009
LCROSS Lunar Impactor Mission Early processed results from the LCROSS
shepherding spacecraft's instruments are summarized at
http://www.nasa.gov/mission_pages/LCROSS/main/LCROSS_impact.html and
http://www.nasa.gov/mission_pages/LCROSS/main/LCROSS_impact_images.html.
The science team is now preparing to present more at the Lunar
Exploration Analysis Group (LEAG) meeting to be held in Houston, TX,
Nov 15-19, 2009 and submit results for peer review.
Thanks for your continued interest in this unique mission. -LCROSS
Facebook Team.
===========

Arnold Ashcraft
Thanks for the links.
I still haven't found any reference to whether anyone obtained
infrared spectra which might or might not indicate the presence of
ice deposits on the crater floor. So far I have only seen images
taken with infrared sensitive cameras, no spectra. I also have not
seen any rationale for switching targets from a permanently dark
crater like Faustini to one that gets sunlight on the floor like
Cabeus. Am I the only one mystified by this?
Clif

jim phillips
Thanks!
Jim Phillips
cano...@yahoo.com
> I am not sure how to remove my name from this group. Could someone please help me?
> Thanks! Jim Phillips
Sign in using the google group web interface at:
http://groups.google.com/group/lcross_observation
On the right-hand side there is link "Edit my membership".
Click, which goes to -
http://groups.google.com/group/lcross_observation/subscribe
At the right-hand lower part of the page is a button labeled
"Unsubscribe".
Using the subsciption page options, you can also choose the "No email"
option, which retains the group membership, but will stop the group
mailer from plugging up your email box.
Clear Skies - Kurt
cano...@yahoo.com
The LCROSS Team appears to have the spectra data but plans to release
it through a traditional peer review process, apparently beginning at
the LEAG conference on Nov. 15. It will be interesting to see what
the results are.
As to the target change, my reading is that the team went for the
highest region of H concentrations indicated by the most recent LRO
overflight data. The location was in a very deep and very dark PSR
hole - 3.5 to 3.8 km below the Cabeus rim and almost 6.5km below the
M1 ridgeline that masked the impact from Earth view. The Cabeus
target choice seems like good common sense science, IMHO.
I have taken some time to look at the Earth view masking effect of the
M1 ridgeline considering the 3.5 degree libration in latitude at the
time of impact. I concluded that there was a near zero chance of
seeing the 5km high by 10 km dia plume from Earth at that impact
location. The masking effect of M1 was too large.
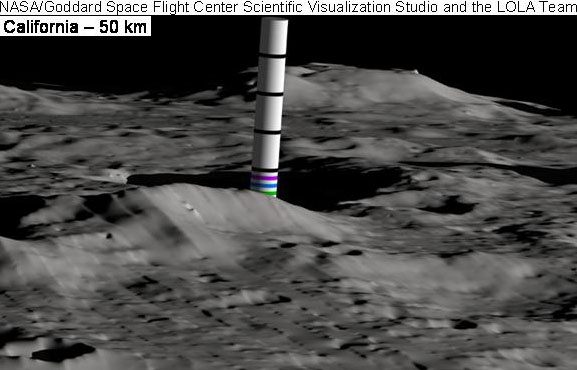
The NASA Goddard Spaceflight Center and Lola Team "dipstick" graphic
in http://apps.nasa.gov/lcross/observations/files/19/ of October 2,
2009 on which the LCROSS Team concluded that the plume needed to rise
only "1.8km to 2km" to be visible from Earth erred. The quote from the
document is "[t]he measuring rods indicate Earth visibility beginning
between 1.8 and 2 km." The "dipstick" in the "dipstick" graphic is
positioned at the wrong height. My computation for the minimum rise
height for the plume to be visible from Earth was about 4.75km.
That the GSC-Lola dipstick graphic errs can be seen by simple
examination of the Oct. 2, 2009 dipstick graphic and a thought
experiment. Dig a hole, let's say 3.5 meters deep in your front yard
(that's your front yard, not my front yard), mark a 5 meter stick at
3.5 meters and 2.5 meters and then put the stick in the hole, Step
back 5 to 10 meters. No matter what angle you look down at the stick
(simulating negative lunar libration), there is no way you will see
the 2.5 meter mark on the dipstick appear to "hover" above the 3.5
meter rim the hole, even without the masking effect of - let's say a
wheel barrel - in the foreground. But that is what the GSC-Lola Team
dipstick graphic purports to show.
An estimate of actual size of the plume at peak brightness has not
been released yet by the LCROSS Team. The shepherding satellite
images that you mentioned assert a 6km-8km dia at 15 seconds -
implying a scaled height of 3 to 4km, but the plume appears ellipsoid
and distorted from a circular shape.
There is a potential that the plume expanded more after the 15 sec
mark. Conversely, the impact point appears to be located such that
the expanding plume would have interacted on the northwest side with
the Cabeus rim and on the southwest by a slight rise before the plume
would have expanded to its full 10 km diameter pre-impact model size.
These terrain variations would have caused the plume to depart from
the pre-impact model, speculatively resulting in a plume only 3km
high.
IMHO, all of this is fine, since LCROSS was a high risk experiment and
the main priority always had to be spacecraft science and not us Earth-
based ground pounding amateurs. That there will apparently be - based
on what has been released so far - no professional ground based
confirmation of the spacecraft results is unfortunate. Whatever the
results of the spacecraft spectroscopy are, they will have less
authority and will be taken less seriously without confirmation by
contemporaneous Earth-based observations.
But the main point, as you note, is whether the shepherding satellite
captured the spectrometry data - which appears to have occured - and
what the spectrometry results are - which we will hear in mid-
November.
I'm not mystified by the LCROSS Team not releasing the results early;
they are just being careful and following generally accepted
scientific protocol for publishing.
Personally, I'm just hanging out a little longer to see how the story
turns out.
Here's hoping for a "wet" spacecraft spectrograph result. If the
results are positive, maybe it will spur enough interest for a purpose-
built LCROSS-2 "better-faster-cheaper" mission. LCROSS-1 was always
hobbled by the fact that it's operational capability was dictated by
being a tag-along to LRO.
Nice meetin' ya. Since you contributed images on the Deep Impact
mission and did a lot of imaging here, I hope to see you the next time
that NASA decides to crash something into a solar system body.
Clear Skies - Kurt
On Oct 28, 2:33 pm, Arnold Ashcraft <wa2...@optonline.net> wrote:
> Kurt:
> Thanks for the links.
> I still haven't found any reference to whether anyone obtained
> infrared spectra which might or might not indicate the presence of
> ice deposits on the crater floor. So far I have only seen images
> taken with infrared sensitive cameras, no spectra. I also have not
> seen any rationale for switching targets from a permanently dark
> crater like Faustini to one that gets sunlight on the floor like
> Cabeus. Am I the only one mystified by this?
> Clif
>
>
> > From the LCROSS Facebook page
>
> > ===========
> > 10-27-2009
>
> > LCROSS Lunar Impactor Mission Early processed results from the LCROSS
> > shepherding spacecraft's instruments are summarized at
>
> >http://www.nasa.gov/mission_pages/LCROSS/main/LCROSS_impact.htmland
>
> >http://www.nasa.gov/mission_pages/LCROSS/main/
> > LCROSS_impact_images.html.
>
> > The science team is now preparing to present more at the Lunar
> > Exploration Analysis Group (LEAG) meeting to be held in Houston, TX,
> > Nov 15-19, 2009 and submit results for peer review.
>
> > Thanks for your continued interest in this unique mission. -LCROSS
> > Facebook Team.
>
>
> - Show quoted text -

Jim Mosher
> hole - 3.5 to 3.8 km below the Cabeus rim and almost 6.5km below the
> M1 ridgeline that masked the impact from Earth view.
time of impact. That it was "a very deep and very dark
PSR" (permanently shadowed region) is much less obvious to me. The
few graphics I've seen of permanently shadowed regions represented
calculations based on ground-based radar data. Areas like the region
to the immediate south of M1, and the LCROSS impact point, appear
black on the radar maps. That does not necessarily mean they are
deep, but only that there is no data there, because the surface is
hidden from view. The LOLA contours in Slide 4 at:
http://groups.google.com/group/lcross_observation/msg/ab2811a3c4c6de9b
are rather difficult to read, but it does not appear to me that the
impact points were exceptionally low (-3.8 km on the LOLA scale,
compared to -4.9 km in the crater within a crater on Cabeus' floor),
and the larger radar-hidden area south of M1 is actually relatively
high (-3 km?), rather than low (I'm not sure where the Cabeus rim is
on this scale). And, as Clif points out, much of the floor of Cabeus
is frequently, including at the time of impact, in sunlight, so rather
than being "very dark" a relatively high level of secondary reflected
light from the crater interior might, at least sometimes, be expected
at the impact points.
> That the GSC-Lola dipstick graphic errs can be seen by simple
> examination of the Oct. 2, 2009 dipstick graphic and a thought
> experiment.
unable to understand why looking at a downward angle over the rim of a
hole you can't see an elevation mark on a dipstick lower than the rim
height, nor do I find anything obviously incorrect about the Goddard
Spaceflight Center/LOLA simulation.
The areas (near M1) likely to be responsible for the topographic
masking look to be about 40 km from the impact points. At the time of
the LCROSS impacts, the impact points, as seen from Hawaii were 82.65°
from disk center. This means the surface was tipped by an angle of
about 90-82.65 = 7.3° relative to the line of sight from Earth. The
tangent of 7.3° is 0.13. If the Moon were a plane surface, looking
over a distance of 40 km at this downward angle you would expect to
see to an elevation 0.13*40 km = 5.1 km below the elevation of the
masking point. If you are correct that the impact points (the bottom,
or zero point, of the "dipstick") are 6.5 km below the masking level,
the lowest elevation mark you would see on the dipstick would be
6.5-5.1 = 1.4 km.
Including the effect of the curvature of the Moon over 40 km (which
lowers the bottom of the dipstick, making less of it visible) looking
at a downward angle of 7.3° over 40 km one would expect to see to a
level 4.7 km closer to the Moon's center than the original level, or
6.5-4.7 = 1.8 km above the impact point (assuming the bottom of the
dipstick, at the impact point, is 6.5 km closer to the Moon's center
than the masking point).
Again, I'm not sure where the 6.5 elevation difference between the
masking surface and the impact points comes from, but looking at an
angle of 7.3° over 40 km I would expect to see down the dipstick by an
amount similar to that shown in the GSC/LOLA graphic.
-- Jim
On Oct 28, 3:47 pm, "canopu...@yahoo.com" <canopu...@yahoo.com> wrote:
> Chris,
>
> The LCROSS Team appears to have the spectra data but plans to release
> it through a traditional peer review process, apparently beginning at
> the LEAG conference on Nov. 15. It will be interesting to see what
> the results are.
>
> As to the target change, my reading is that the team went for the
> highest region of H concentrations indicated by the most recent LRO
> overflight data. The location was in a very deep and very dark PSR
> hole - 3.5 to 3.8 km below the Cabeus rim and almost 6.5km below the
> M1 ridgeline that masked the impact from Earth view. The Cabeus
> target choice seems like good common sense science, IMHO.
>
> I have taken some time to look at the Earth view masking effect of the
> M1 ridgeline considering the 3.5 degree libration in latitude at the
> time of impact. I concluded that there was a near zero chance of
> seeing the 5km high by 10 km dia plume from Earth at that impact
> location. The masking effect of M1 was too large.
>
> The NASA Goddard Spaceflight Center and Lola Team "dipstick" graphic
cano...@yahoo.com
<snip>
> I must be missing something about the thought experiment, for I am
> unable to understand why looking at a downward angle over the rim of a
> hole you can't see an elevation mark on a dipstick lower than the rim
> height, nor do I find anything obviously incorrect about the Goddard
> Spaceflight Center/LOLA simulation.
2.5km marker apparently floating relatively above the rim of Cabeus to
the immediate west. That is what the graphic shows. The lowest green
strip on the dipstick or "candy cane" marks 2.0 to 2.5km. It should
appear to be below the rim; it appears to float above the level of the
rim. Even if the green strip is the 3.0 to 3.5km marker, it should
appear to be slightly lower or level with the west Cabeus rim to the
immediate west. This because the LOLA map shows the impact point at
3.8km below the rim.
> At the time of the LCROSS impacts, the impact points, as seen from Hawaii
> were 82.65° from disk center. This means the surface was tipped by an
> angle of about 90-82.65 = 7.3° relative to the line of sight from Earth.
libration (3.5) angle, then my computations err and you are correct.
Thanks for the correction.
Would the tipping angle for Hawaii not be lower? 84.675S for the
planned impact latitude of the Centaur less 3.6 for topocentric
libration for Hawaii gives 81.2.
> If you are correct that the impact points (the bottom,
> or zero point, of the "dipstick") are 6.5 km below the masking level,
> the lowest elevation mark you would see on the dipstick would be
> 6.5-5.1 = 1.4 km.
LOLA model errs, since the 1.5km marker is not visible on the
disptick. The 1.5km dipstick marker is 1.5km below the masking
ridge.
If your computation is correct, than the 1.5km marker (the top of the
yellow band) should be visible.
> And, as Clif points out, much of the floor of Cabeus
> is frequently, including at the time of impact, in sunlight, so rather
> than being "very dark" a relatively high level of secondary reflected
> light from the crater interior might, at least sometimes, be expected
> at the impact points.
including Faustini. Models of comet deposited hydrogen in PSRs are
based on the notion that hydrogen bearing deposits must be buried
relatively quickly by a second impact. Even the ultra low level of
light from Milky Way over a million years can evaporate surface
deposited hydrogen in a PSR. However, I do not recall any of the
journal articles that I read including the effect of reflected
interior crater surface light, e.g. that reflected light which
undoubteldy occurs at the wide and flat Faustini PSR or at the Cabeus
LCROSS impact site.
Again, thanks for the correction on the tipping angle.
Clear Skies - Kurt
P.S. - At the end of the LCROSS Team presentation at SETI, Colaprete
speculated that the plume may not have followed the lampshade model.
He made a pre-publication reference to the possibility that the plume
had a re-bounding water droplet shape - one of the scenarios the
Colaprete stated that Schultz identified in JPL high-velocity gun
experiments using hollow sphere impactors into a loose unconsolidated
surface.
cano...@yahoo.com
<snip>
> examination of the Oct. 2, 2009 dipstick graphic and a thought
I have uploaded a markup of the GSC-LOLA graphic that illustrates the
inconsistency in the simulation. - Clear Skies, Kurt
http://01227941410742638900-a-g.googlegroups.com/web/20091103DipstickMarkup_kf.jpg
Jim Mosher
Thank you for posting the revised graphic at:
http://01227941410742638900-a-g.googlegroups.com/web/20091103DipstickMarkup_kf.jpg
illustrating your concerns about the Goddard-LOLA masking simulations
in LCROSS Principal Investigator Tony Colaprete's October 2, 2009
target area presentation at:
http://lcross.arc.nasa.gov/docs/LCROSS_Target_Update_100209.ppt
The second part of your graphic, using the Cornell-Smithsonian radar
image is also helpful, although the line that says "limit observable
limb" seems incorrect. The observable limb should be roughly parallel
to, but distant from this line by about as much as your present line
is distant from the impact site -- far enough to include the prominent
peak "M5" (seen beyond the dipstick in the Goddard/LOLA simulations,
but not visible in the segment of the radar image you show) on the
Earthward side of the limb. Finally, to align the images, the "to
Earth observer" arrow should be parallel to the dipstick direction.
Regarding your thesis that the LCROSS impact was hidden from Earth to
a greater extent than Tony's graphics indicate, it is certainly true
that computers and their programmers can make errors, but in the
absence of such errors, computers are usually much better at
accurately visualizing three-dimensional relationships than most of us
are, and this seems to be the case here.
I must apologize for misunderstanding your earlier message in which I
thought your concern was that the simulation showed markings on the
dipstick at elevations lower (less far from the Moon's center) than
the elevation of the ridge (M1) behind which it was seen. That is
actually no more surprising than the fact that a bit beyond the
dipstick we can see the still lower floor of crater (much of which is
in shadow) -- both simple consequences of the fact that we are looking
down on the scene from above.
Now I see your concern is with how the markings on the dipstick
compare to points of known elevation to the east and west. In
addition to some ancillary issues, those relationships may be harder
to visualize than we may at first imagine.
The first ancillary issue is how the stripes on the dipstick/candy
cane are intended to be read. You seem to be confident the even
kilometer points come at the *bottom* of the stripes (bottom of green
stripe = 2.0 km, top = 2.5 km, middle = 2.25 km, etc.). From the
measurements he cites in Slide 8, I would guess Tony takes the even
kilometer points to come in the *middle* of the stripes (middle of
green stripe = 2.0 km, bottom = 1.75 km, top = 2.25 km, etc.). Thus
masking by M1, along the centerline of the dipstick, to the from a
little above the bottom of the green stripe (in Hawaii and New Mexico,
Slides 11 and 13) to near the middle of the green stripe (from
California, Slide 9) he calls "1.8 to 2 km"; and the sunlight/shadow
line near the midpoint of the yellow stripe (Slide 15) he calls "about
1 km".
The second ancillary issue is how to read the LRO/LOLA altimeter
contours in Slide 4. Somewhere you implied that the contours have
been adjusted so that "0" matches the rim height of Cabeus. I don't
think this is true. Slide 2 says the modeled impact point elevation
of -3.82693 km is its offset from a reference surface 1737.4 km above
the Moon's center. My guess is that the "0" LOLA contour is the same
reference elevation. So when in your graphic you mention a point at
"DEM 2.5 km" one would be looking for a contour of -3.8+2.5 = -1.3 km.
The contour levels themselves are very difficult to read because no
distinction is made between up and down slopes. The levels are a bit
less ambiguous if one superimposes them on the shaded nadir view of
Slide 16, after enlarging the latter by 193% and rotating it 90° CCW.
I am guessing your reference points are at the right-hand ends of your
light green lines. I believe I may be able to see the point you refer
to as "DEM 3.8 km" (= the LOLA "0" contour), on the Earthward rim of a
little crater sandwiched between two larger ones. It looks like you
have perhaps set the top edge of the green line tangent to the crater
rim.
I am unable to locate or verify your "DEM 2.5 km" point. That light
green line appears to end on the far inner wall on a crater that is
outside the LOLA contours of Slide 4.
You seem to find it disturbing that when you extend the light green
line from the "DEM 3.8 km" point horizontally to the left, the top of
the green line intersects the dipstick at what you read as about 3.4
km and what Tony would perhaps read as 3.2 km.
I find nothing disturbing about this. In the first place, there is no
significance I can think of to the horizontal direction in the
simulation. The dipstick presumably represents a line emanating
radially outward from the lunar surface at the impact point (it is
seen end on in the nadir view of Slide 16). I have no idea why it is
shown tipped at an angle, but one could imagine a second radial stick
emanating out of the "DEM 3.8 km" point on the Earthward rim of the
little crater. That stick would be tipped at an even greater angle.
This point is expected to project farther out from the disk center
than the 3.8 km mark on the dipstick simply because its base point is
farther from disk center than the base of the dipstick. Moreover, the
connecting lines needed to compare the two projections would not be
straight lines, but rather circular arcs about disk center. Such
circular arcs, if properly drawn, would intersect both sticks at right
angles. I am not completely sure what the radius of curvature in the
Goddard/LOLA simulation is, but if I try to imagine such an arc
tangent to the Earthward rim of the little crater it looks to me like
its top edge would intersect the dipstick not a little below the top
of the blue 3 km stripe (as you show), but rather a bit above the top
of the black 5 km stripe.
This does not indicate there is anything wrong with the markings on
the dipstick, but only that a "DEM 3.8 km" point, whose base is
farther from disk center (the little crater rim), projects farther
from disk center than a point whose base is closer to disk center (the
Centaur impact point); and given the ~7.3° at which we are looking
down on the scene, the magnitude of the difference seems consistent
with the little crater reference point being ~20 km farther from disk
center than the Centaur impact point.
> Would the tipping angle for Hawaii not be lower? 84.675S for
> the planned impact latitude of the Centaur less 3.6 for
> topocentric libration for Hawaii gives 81.2.
"tipping angle" (90° - distance from center) becomes larger as the
feature moves towards disk center, and we look more directly down on
it. Calculating the distance from disk center by combining latitude
with libration in latitude works only for objects on the central
meridian (which Cabeus is not). A correct calculation requires
comparing the longitude and latitude of the sub-observer point with
the longitude and latitude of the point of interest, using spherical
trigonometry. The Sun Angle calculator at:
http://the-moon.wikispaces.com/Sun+Angle
implements the correct equations. For an impact point at 48.725W,
84.675S, the distances from disk center, and tip of the impact
surface, at 2009 Oct 09 11:35 UT were:
Observer Sub-Observer
Location Long Lat Long Lat Distance Tip
Hawaii -155.47 19.83 -2.165 -3.689 82.66 7.34
Sunnyvale -122.27 37.46 -2.681 -3.540 82.77 7.23
New Mexico -106.70 32.29 -2.891 -3.652 82.65 7.35
If one compares the Goddard/LOLA simulations carefully, the very
slightly greater tipping towards Earth as seen from Hawaii and New
Mexico is evident in the peak of M5 being closer to the 20 km mark on
the dipstick compared to the view from "California" (whether
"California" means Sunnyvale or Mount Wilson is unclear, but would
only slightly change the results). As expected, the horizontal
shearing due to the 0.7° difference in longitudinal libration is more
evident than the 0.1° variation in tip.
> Your computation also seems inconsistent with the LOLA model
> or the LOLA model errs, since the 1.5km marker is not visible
> on the disptick.
spherical curve of the Moon's surface, and that was based on your
estimate (of unknown origin) of the difference in elevation between
the masking ridge and impact point.
Neglecting the Moon's curvature, over a distance 40 km at a tip of
7.3° you would expect to see to a point 5.1 km below the obstruction
height. Correcting for the Moon's curve, for the same distance and
tip, you can see to something like 4.66 km below the elevation of the
obstruction.
> The 1.5km dipstick marker is 1.5km below the masking ridge.
mark visible on the dipstick behind the masking ridge is 1.8 to 2.0
km. That would put the 1.5 km dipstick marker about 0.3 to 0.4 km
below the ridge at that point.
> If your computation is correct, than the 1.5km marker (the
> top of the yellow band) should be visible.
of the dipstick. But a computation uncorrected for the Moon's
curvature over 40 km is not expected to be correct; nor is the data
available to me on the height of the masking ridge relative to the
impact point accurate enough for such a comparison to be meaningful.
The Goddard/LOLA graphics show the projected height of the ridge
varies by very nearly 1 km over the 3.5 km width of the stick.
--
In summary, while I can't vouch for the accuracy of the LRO/LOLA
Digital Elevation Model, the Goddard Space Flight Center renderings
look like an accurate depiction of it to me.
--
> Even the ultra low level of light from Milky Way over a
> million years can evaporate surface deposited hydrogen in a
> PSR. However, I do not recall any of the journal articles
> that I read including the effect of reflected interior crater
> surface light, e.g. that reflected light which undoubteldy
> occurs at the wide and flat Faustini PSR or at the Cabeus
> LCROSS impact site.
that the floors of deep craters near the pole (like Faustini, or even
better, Shackleton) are always in shadow which, to layman, seems a
much colder and more conducive environment to finding ice than a
larger crater farther from the pole, much of whose floor is bathed in
sunlight. As a crude analogy, choosing Cabeus over Shackleton or
Faustini seems somewhat like an explorer in a broad sunlit valley of
the American Southwest seeking shelter in the shaded slope at the foot
of a north-facing hill (where, looking to the north one still sees a
vast expanse of bright sunlit landscape) as opposed to looking in a
deep pit from whose bottom one can see nothing but sky. On the Moon,
the sky is very dark, so the difference between a dark pit from which
one can only see sky and a shaded slope from which a sunlit landscape
is visible is even more stark.
I know nothing about the evaporation of ice by light from Milky Way,
but I would certainly think the amount of sunlight scattered off
crater inner walls (and floors, in the case of Cabeus) would be much
more significant and must be included in models of temperatures
expected in such environments.
Although we think of the shadowed areas of craters as being very dark,
I don't think this is correct. In human terms, we know that on Earth
moonlight (at Full Moon) is about 400,000 times weaker than sunlight,
yet it is strong enough to read the headlines in a newspaper. This
comes from having a source in the sky covering a 0.5° diameter circle
(0.2 square degrees solid angle) with the brightness of lunar surface
reflections. For sources of similar brightness, the intensity detected
is proportional to the solid angle filled by the source. From shaded
parts of the Moon's surface one sees a source (or sources) of similar
brightness, but covering a different area of the sky.
The intensity in a "very dark" crater like Shackleton can be crudely
estimated by assuming it is a truncated cone about 20 km in diameter
and 4 km deep, with a floor of some small extent, say 10 km in
diameter. If the Sun peers over the rim at an angle of 2° (about the
steepest it can get this close to the pole), we would expect about 0.7
km of inner wall (on the opposite side) to be in sunlight. Looking up
at this from a point on the floor 5 km from the centerline, one would
see the sunlit inner wall about 7° away from edge-on, which would
foreshorten it to an effective width across the line of sight of about
0.1 km. At a distance of 15 km, this corresponds to a vertical extent
of about 0.5°. To the sides, the ribbon of light would extend over
roughly 180°, but getting thinner towards the edges; so the total
solid angle of sunlit inner wall seen in the sky would be about (1/2)x
(0.5°)x180° = 45 square-degrees. This is ~200 times more area (of
similar brightness) to what the Full Moon presents in our nighttime
sky, so the intensity of light falling on this point on the floor of
Shackleton is going to be ~200 times more than we are accustomed to on
a moonlight night on Earth. This is still ~2000 times weaker than the
same scene illuminated by direct sunlight; but just as lunar craters
are much shallower than we imagine, it would seem the shadows are much
less dark -- at least at times when a piece of sunlit landscape is
visible from the shadowed point.
I find it much harder to visualize what the landscape looks like from
the LCROSS impact point on the floor of Cabeus -- I would imagine that
much of the month you see sunlit floor to the south and east, probably
some of the inner rim, and possibly the top of M5 off in the distance
to the south? Intuitively I would think it adds up to many more square
degrees of illuminated area than the thin ribbon of sunlit inner wall
sometimes visible from the floor of Shackleton, so I would think the
ambient light level would be correspondingly higher (at least when it
is local noon there). I would also expect the ambient light level in
the shaded areas of Cabeus to be much higher than in Faustini,
Shoemaker, and other craters closer to the pole whose floors are
always in shadow.
-- Jim
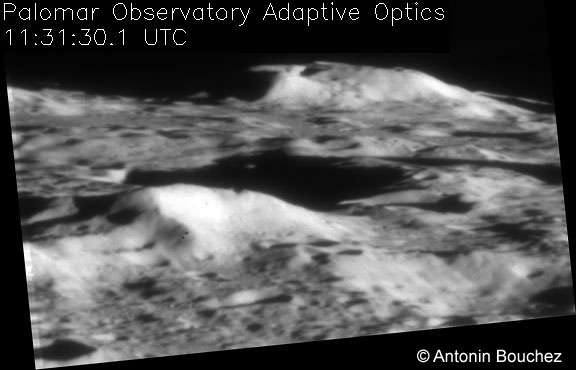
Jim Mosher
masking simulations, I tried rotating and rescaling one of Antonin
Bouchez' Palomar images:
http://www.astro.caltech.edu/palomar/lcross.html
to match Slide 9 ("California 50 km") in Tony Colaprete's presentation:
http://lcross.arc.nasa.gov/docs/LCROSS_Target_Update_100209.ppt
giving the results shown in the two attachments. When one blinks
between the two images one sees a slight skewing, but the relative
heights of features (and the extent to which background features are
masked by foreground ones) seems quite close to what the LOLA model
predicts. The skewing may be due to the "California" simulation being
a view from Ames Research Center rather than from Mount Palomar (the
exact location in California is not mentioned). This does not prove
that the dipstick is correctly positioned or calibrated, but the lunar
surface model on which it is superimposed seems remarkably accurate.
The main difference I notice is that the shadows observed from Mount
Palomar are systematically longer and cover the surface features a bit
more deeply than predicted. Although shadow lengths can vary with the
way in which intensity levels are processed, I doubt that is the
problem here. The images acquired by the Shepherding Spacecraft:
http://www.nasa.gov/mission_pages/LCROSS/main/LCROSS_impact_images.html
seem to confirm that the floor of Cabeus was more in shadow than would
have been expected from the LOLA simulations (flip and rotate the
spacecraft images to compare to the predicted nadir view, Slide 16 in
the PowerPoint presentation).
Since the surface model seems accurate, and the features that are in
shadow do not change with viewpoint, my guess is that the Sun was set
slightly too high in the model, or (possibly) everything from which
even the very top of the Sun is visible is shown in sunlight. The
error would not have to be large: over level ground at a sun angle of
7°, a 0.5° increase in sun angle would shorten 50 km long shadows by
about 6 km, and 20 km long shadows by about 1.5 km.
-- Jim
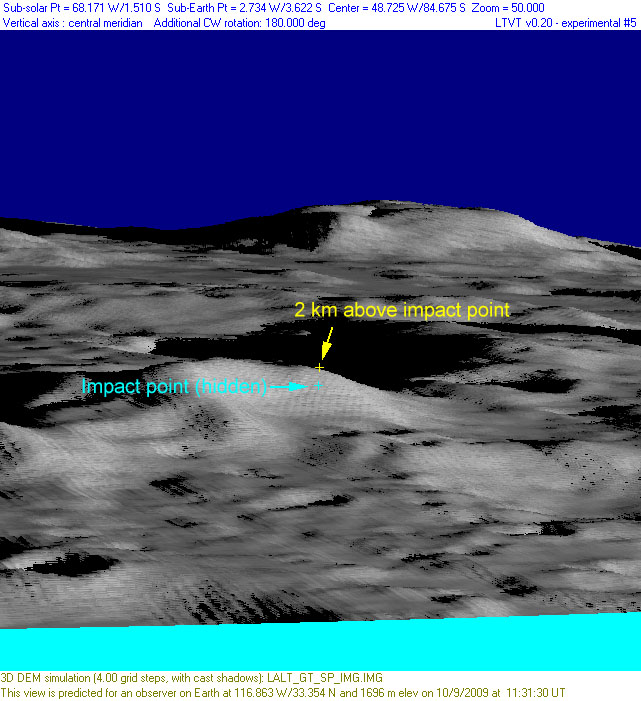
Jim Mosher
the LCROSS impact point based on the recently-released Kaguya digital
elevation model of the Moon's south pole (the 64 points per degree of
latitude version), as rendered by LTVT_v0_20:
http://ltvt.wikispaces.com/LTVT+Download
It shows the Moon as viewed from Mount Palomar at the time of that
image. The Kaguya impact location has been using the LCROSS
pre-impact coordinates (48.725°W/ 84.675°S) and the elevation read
from the Kaguya DEM at that point (1733.754 km). One reference mark
was placed at the impact point, and another 2 km vertically above it.
Although the resolution is not quite as high as in the Goddard/LOLA
simulation, the lighting pattern looks slightly closer to what was
observed (note particularly, the subtle differences in the way the
limb peak "M5" is lit), so I think the Sun angle (and perhaps the
surface heights) is more accurate. Otherwise, the results look quite
consistent.
-- Jim