Visualization Challenge Submission

Mike Porter
Attached is our submission for the iEvoBio Visualization Challenge. We
are submitting our application GenGIS (http://kiwi.cs.dal.ca/GenGIS),
and free and open source (GNU GPL) 3D application for the
visualization of genetic data (including hierarchical relationships)
in a geographic context.
Enclosed is the abstract and 3 screenshots taken directly from GenGIS
sessions. Of the screenshots, 1 shows the entire application window,
the others have been cropped to only show the viewport.
Note that not only the software, but also all cartographic and genetic
data used to generate these images are freely available and can be
shared and repackaged (unlike, for instance, Google Earth maps).
The screenshots are:
1. GenGIS_GOS.png - Sample sites from the Global Ocean Sampling
Expedition off the Atlantic coast of North America. The hierarchy on
the left shows the metabolic similarity of sites; the hierarchy on the
right shows the taxonomic similarity based on 16S rRNA marker genes.
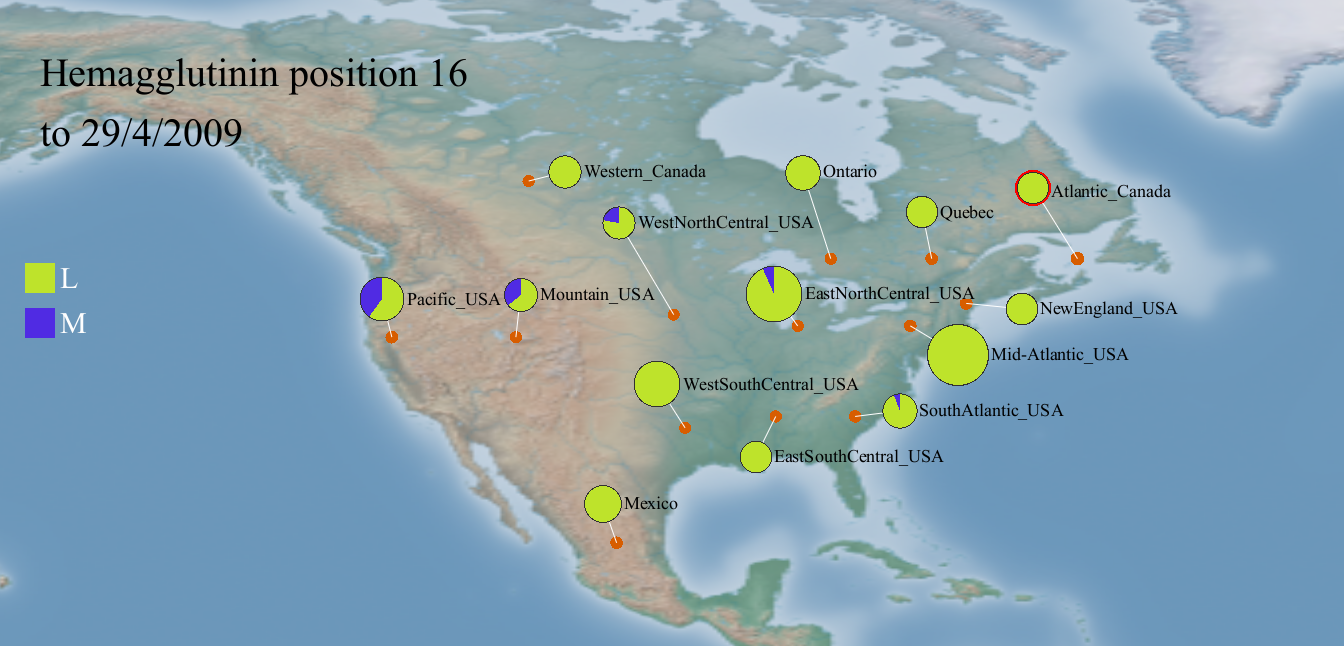
2. HA_16_screenshot.png - The distribution of amino acid frequencies
observed at position 16 in the Hemagglutinin protein from the recent
pandemic Influenza A H1N1 strain, for all isolates collected on or
before 29 April 2009. The size of each pie chart is proportional to
the number of sequenced isolates from different regions in North
America.
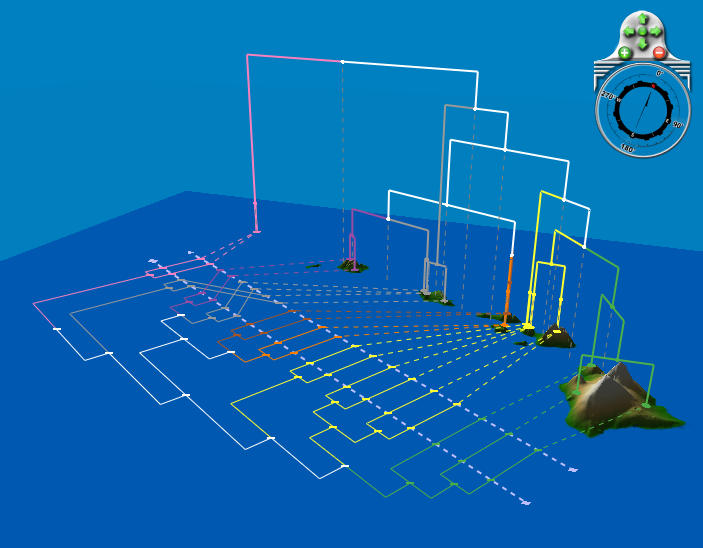
3. Katydids.png - Phylogeny of Hawaiian Katydids shown as both a
vertical 3D geophylogeny and a 2D projection which highlights the
correlation with the underlying geography.
Let me know if anything seems missing or if there are any problems.
Thanks,
Mike Porter