calculate "artificial" servers from a set of R and lambda?

Martin Berger

M Edward Borasky
a while back (2008 CMG conference, to be exact) from "iostat" data on
Linux during a disk benchmark. Something like a scatterplot matrix
would work for what you're trying to do, I think.
2012/3/15 Martin Berger <martin....@gmail.com>:
> --
> You received this message because you are subscribed to the Google Groups
> "Guerrilla Capacity Planning" group.
> To view this discussion on the web visit
> https://groups.google.com/d/msg/guerrilla-capacity-planning/-/FOrml1fl9msJ.
> To post to this group, send email to
> guerrilla-cap...@googlegroups.com.
> To unsubscribe from this group, send email to
> guerrilla-capacity-...@googlegroups.com.
> For more options, visit this group at
> http://groups.google.com/group/guerrilla-capacity-planning?hl=en.
--
Twitter: http://twitter.com/znmeb Data Journalism Developer Studio
2012LX http://j.mp/DJDS2012LX
"A mathematician is a device for turning coffee into theorems." -- Paul Erdős

DrQ
First, let me see if I can more accurately rephrase your question (with corrected notation) to check my understanding.
Suppose you have measurements for the following metrics:
- Response time or, more accurately, residence time: R
- Arrival rate of requests: λ
- Service times at each service process or facility: S
If you plot those data as follows:
- (R/S) on the y-axis
- (λ/S) on the x-axis
we would expect them to fall in a more or less convex arrangement, i.e., tending to bend upward with increasing traffic. See Figure 1 of this blog post. With these assumptions, and denoting the number of active service processes by m, your question then becomes: Can we determine which m value best matches those data?
In principle, you can, but not if you don't know the mean service time S.
Assuming you do know S, it's easiest to apply the power law approximation to the exact Erlang residence-time formula:
(R/S) = 1 / [ 1 - (λ/S))^m ] .... See eqn. (4.68) in my Perl::PDQ book.
You can solve for (or fit) m, but not both m and S simultaneously.
On Thursday, March 15, 2012 9:00:56 AM UTC-7, M. Edward (Ed) Borasky wrote:
I did a lot of multidimensional exploratory plots around Little's Law
a while back (2008 CMG conference, to be exact) from "iostat" data on
Linux during a disk benchmark. Something like a scatterplot matrix
would work for what you're trying to do, I think.
2012/3/15 Martin Berger:
> Maybe my idea sounds somewhat strange, so please tell me if I have some big
> failures anywhere:
> Many here might now the nice graph with "Arrival rate" (R) on the x-axis and
> "Response time" (λ) on y-axis.
> It's also some fun to change the number of "servers" in the underlying
> excels/R/whatever to show slightly different graphs.
> My question is now if someone ever tried to calculate an artificial value
> for the servers (M) for a given set of measurements (R,λ) on a totally
> unknown system?
> Is this value of any usage, to describe the system? (The Service time would
> be also an outcome of this calculation, I guess).
> Any comments on this approach?
>
> thank you,
> Martin
>
> --
> You received this message because you are subscribed to the Google Groups
> "Guerrilla Capacity Planning" group.
> To view this discussion on the web visit
> https://groups.google.com/d/msg/guerrilla-capacity-planning/-/FOrml1fl9msJ.
> To post to this group, send email to
> To unsubscribe from this group, send email to
> For more options, visit this group at
> http://groups.google.com/group/guerrilla-capacity-planning?hl=en.
DrQ
You cannot analytically solve for m without knowing S, but you could do a regression fit for both m and S simultaneously.
To clarify what I mean by solving for m, that corresponds to determining which of the possible m-curves (in Figure 1) your data lies on.
Another way to look at it is, the "flatter" the data under heavy traffic, the greater the value of m servers.

Andrew Sliwkowski
To view this discussion on the web visit https://groups.google.com/d/msg/guerrilla-capacity-planning/-/oL2q-USn3BEJ.
To post to this group, send email to guerrilla-cap...@googlegroups.com.
To unsubscribe from this group, send email to guerrilla-capacity-...@googlegroups.com.
DrQ
The per-server utilization is: ρ = λ / (mS), where you have to divide by the number of servers (m) to ensure that ρ < 1. You can't have any server busier than 100% of the time.
Then, the normalized residence time is given by:
(R/S) = 1 / [ 1 - ρ^m ]
Once again, you see how much m and S get mixed together.
Sorry about that. Please consider that I have now been slapped by a recursive Socrates. :)
Martin Berger
thank you for your 2 replies.
I did the formal transformations before and my equitation was
R = S / [ 1 - ( λ/(mS) )^m ]
that was the point where I decided to ask the group.
Your assumption regarding my question is correct. I still try to do my
best to make it somehow useable for me:
Can I say "If I have a measurement with a very small λ (max. only one
request is in the whole system at the same time) I can say S ≈ R" ?
This would make the whole problem slightly easier :-)
I will have to force R (the program, not the residence time) to solve
my problem.
>>>> > guerrilla-cap...@googlegroups.com.
>>>> > To unsubscribe from this group, send email to
>>>> > guerrilla-capacity-...@googlegroups.com.
>>>> > For more options, visit this group at
>>>> > http://groups.google.com/group/guerrilla-capacity-planning?hl=en.
>>>>
>>>> --
>>>> Twitter: http://twitter.com/znmeb Data Journalism Developer Studio
>>>> 2012LX http://j.mp/DJDS2012LX
>>>>
>>>> "A mathematician is a device for turning coffee into theorems." -- Paul
>>>> Erdős
>
> --
> You received this message because you are subscribed to the Google Groups
> "Guerrilla Capacity Planning" group.
> To view this discussion on the web visit
> https://groups.google.com/d/msg/guerrilla-capacity-planning/-/zzVSiS3ahHUJ.
>
> To post to this group, send email to
> guerrilla-cap...@googlegroups.com.
> To unsubscribe from this group, send email to
> guerrilla-capacity-...@googlegroups.com.
> For more options, visit this group at
> http://groups.google.com/group/guerrilla-capacity-planning?hl=en.
--
Martin Berger martin....@gmail.com
Lederergasse 27/2/14 +43 660 660 83306
1080 Wien http://berx.at/
DrQ
min(R) = S for all standard queueing systems, because the shortest residence time is just the service time (i.e., no waiting time) and occurs only when ρ ≈ 0 or λ ≈ 0.
Equivalently for the normalized residence time, R/S → 1 as ρ → 0.
On Thursday, March 15, 2012 12:39:33 PM UTC-7, Martin Berger wrote:
Neil,thank you for your 2 replies.
I did the formal transformations before and my equitation was
R = S / [ 1 - ( λ/(mS) )^m ]
that was the point where I decided to ask the group.
Your assumption regarding my question is correct. I still try to do my
best to make it somehow useable for me:Can I say "If I have a measurement with a very small λ (max. only one
request is in the whole system at the same time) I can say S ≈ R" ?
This would make the whole problem slightly easier :-)I will have to force R (the program, not the residence time) to solve
my problem.
>>>> > To unsubscribe from this group, send email to
>>>> > guerrilla-capacity-planning+unsub...@googlegroups.com.
>>>> > For more options, visit this group at
>>>> > http://groups.google.com/group/guerrilla-capacity-planning?hl=en.
>>>>
>>>> --
>
> --
> You received this message because you are subscribed to the Google Groups
> "Guerrilla Capacity Planning" group.
> To view this discussion on the web visit
> https://groups.google.com/d/msg/guerrilla-capacity-planning/-/zzVSiS3ahHUJ.
>
> To post to this group, send email to
> To unsubscribe from this group, send email to
> For more options, visit this group at
> http://groups.google.com/group/guerrilla-capacity-planning?hl=en.
DrQ
Everything we've discussed so far is based on the assumption that a single M/M/m queueing model is appropriate. At some point you will need to validate that assumption independently. Why do I say that?
Your starting point (as I understand it) is measured performance metrics. And suppose further that you are able to determine the minimum residence time or minimum response time from those data. That minimum time, however, might not correspond to the service time, as previously discussed.
Consider the case where there is another queue (say, M/M/1 for the sake of argument) preceding the M/M/m queue or succeeding it or both. In other words, there was a tandem arrangement of queued service stages (buffers) in the production system or the test rig. Remember, all you have is your data.
If, for example, there were 3 such stages in tandem and only a single request in the system (as you mentioned earlier), the minimum time to get through that chain of queues would be the sum of the 3 service times at each buffer. In other words, we would now have min(R) = S1 + S2 + S, in which case the minimum response time min(R) != S minimum residence time for the M/M/m stage.
This is one reason why I stress the distinction b/w response time and residence time in my classes. It's one thing to read it in my books; quite another to have me ramming it down your throat in real time. ;-)
DrQ
Martin Berger
again you are correct in your assumption, as well as your warnings.
Personally I am aware it is risky to simplify any system down to the level where I am right now.
In fact the whole system is quite complex: An Oracle cluster with shared storage network and disk arrays below - It is nothing I would ever volunteer to model in any detail in PDQ. But in this exercise my audience (internal application team which uses the DB) are facing 'their' database as a black box.
Currently they are only focused on 'response time' - so they claim, if they change their code to get a better 'response time', they scale better. I just observed sometimes they use much more resources per request to get this better response time. So based on my simple math, they will saturate anything earlier and scale worse.

laks
Two queries here out of curiosity: For the storage subsystem do you
use Oracle orion or any other kit to test the storage scalability
metrics separately and then fit it into a model separately for your
Oracle workload ( OLTP or any other as you need) ?
Dr Q/Neil , For such cases like a typical Oracle Cluster/RAC workload
with a shared storage( NAS/SAN or any other) do you suggest modelling/
testing the storage separately and then do the CPU subsystem
separately (SMP, NUMA)
Pls excuse me if this goes off topic or unrelated.
thx
Laks
On Mar 16, 3:42 pm, Martin Berger <martin.a.ber...@gmail.com> wrote:
> Neil,
>
> again you are correct in your assumption, as well as your warnings.
>
> Personally I am aware it is risky to simplify any system down to the level
> where I am right now.
> In fact the whole system is quite complex: An Oracle cluster with shared
> storage network and disk arrays below - It is nothing I would ever
> volunteer to model in any detail in PDQ. But in this exercise my audience
> (internal application team which uses the DB) are facing 'their' database
> as a black box.
> Currently they are only focused on 'response time' - so they claim, if they
> change their code to get a better 'response time', they scale better. I
DrQ
1) The sequence of PDQ queueing nodes in your CaP model does not have to match every possible component that exists in the real system. It just has to be sufficient to resolve where the major bottlenecks are occurring or will occur in the future.
2) If at all possible it is good to measure the latency of the network storage subsystem separately. The point being that the response time part of the PDQ model should be a lot simpler than you might imagine or that you would read about in a book like Simitci's "Storage Network Performance Analysis," (2003); a good book, btw and I know of no other equivalent book.
laks
Regards
Laks
Martin Berger
in general I try at least to get a 'good knowledge' about the storage
subsystem.
That means a study of the documentation as well as a test with orion
or some other tools. (If you want to test physical and logical IOs of
an oracle instance, maybe you are interested in [1] )
As we have in general full storage networks, there sometimes are
effects our storage admins does not want to accept at first sign. As
an example: we tested one big virtual 'disk' attached to a linux host
versus 10 smaller 'disks (which where based on the same underlying
structures - so they where 'the same thing' - but we got much better
results by these 10 disks. - I was never allowed to investigate this
to find the real reason, but my curent working theory is the multipoe
IO-queues on OS are the key for the better results.
In this particular question I do NOT want to model any sub-system - in
fact I try to do it the other way: step 'back' until I can see the
whole system as a single black box, where all the details can not e
seen anymore.
let's see if it gives me any good :)
Martin
[1] http://kevinclosson.wordpress.com/2012/02/06/introducing-slob-the-silly-little-oracle-benchmark/
> --
> You received this message because you are subscribed to the Google Groups "Guerrilla Capacity Planning" group.
> To post to this group, send email to guerrilla-cap...@googlegroups.com.
> To unsubscribe from this group, send email to guerrilla-capacity-...@googlegroups.com.
laks
also aware of the situation you explain.
On Apr 6, 10:04 am, Martin Berger <martin.a.ber...@gmail.com> wrote:
> Laks,
>
> in general I try at least to get a 'good knowledge' about the storage
> subsystem.
> That means a study of the documentation as well as a test with orion
> or some other tools. (If you want to test physical and logical IOs of
> an oracle instance, maybe you are interested in [1] )
> As we have in general full storage networks, there sometimes are
> effects our storage admins does not want to accept at first sign. As
> an example: we tested one big virtual 'disk' attached to a linux host
> versus 10 smaller 'disks (which where based on the same underlying
> structures - so they where 'the same thing' - but we got much better
> results by these 10 disks. - I was never allowed to investigate this
> to find the real reason, but my curent working theory is the multipoe
> IO-queues on OS are the key for the better results.
>
> In this particular question I do NOT want to model any sub-system - in
> fact I try to do it the other way: step 'back' until I can see the
> whole system as a single black box, where all the details can not e
> seen anymore.
>
> let's see if it gives me any good :)
>
> Martin
>
DrQ
From everything I've seen (which isn't necessarily that much), I believe correctly tuned and appropriately allocated network storage should respond like a memory reference (i.e., remote cache) such that the response time is possibly even dominated by the network latency, on average. This effect probably degrades under heavy traffic conditions. But even if this is just an approximate truth, it should serve as your performance goal, which you may or may not be able to attain, depending on the app and all that. If you can't attain it, you must be able to explain why not. It might not be your fault. :)
The other upshot of this view is that it simplifies any CaP models you may decide to make, e.g., in PDQ. They should be much much simpler than anything you see in Simitci's book.
ASIDE:
- I think I could almost make the above observation of mine into a theorem.
- The problem is, I need more data at different workload intensities (request rates). I have only seen data that lies in some specific bands and it seems to be valid there.
- Many people (including Guerrillas) have promised to provide such, but none have ever delivered.

wouterdb
I've been working on this problem for a while. I've built a least squares fitter for queueing stations. (https://github.com/wouterdb/fitlib)
I found out that just a queueing station doesn't really fit my data all that well, I've played around with some of the suggestions from the PDQ book and added a parameter that scales all lambdas (request rate).
This gives me a formula of the form R(L) = S/(1-(b*L*S/n)^n).
I take n as a given, R and L are measured and b and S are fitted.
The extra b parameter usually yields a pretty good fit (e.g: https://github.com/wouterdb/fitlib/raw/master/example.png)
What do you think of this approach?
Wouter
PS: feel free to play around with the code, patches and datasets are welcome.
DrQ
Wouter De Borger
- I was wondering if anyone else has ever tried to do automated parameter estimation before?
- How can I improve the closeness of fit of the model?
--
You received this message because you are subscribed to the Google Groups "Guerrilla Capacity Planning" group.
To view this discussion on the web visit https://groups.google.com/d/msg/guerrilla-capacity-planning/-/ccRbTVQ2C9cJ.
To post to this group, send email to guerrilla-cap...@googlegroups.com.
To unsubscribe from this group, send email to guerrilla-capacity-...@googlegroups.com.
DrQ
To post to this group, send email to guerrilla-capacity-planning@googlegroups.com.
To unsubscribe from this group, send email to guerrilla-capacity-planning+unsub...@googlegroups.com.
Wouter De Borger
re: Plot. Vast improvement. Nice job. One tweak you might add is to note which model you are fitting against.Anyway, now we can get down to some brass tacks.Before launching off into various performance modeling exotica (like, nonlinear regression and overdriven demand), you need to convince yourself that the target model (i.e., M/M/m) even makes sense for an RDMBS. For example, I could take the position that any RDMBS can only have a finite number (N) of processes handing DB requests. In which case, the queue length is bounded by N. An open queueing model like M/M/m is not compatible with that assumption b/c there, the number of requests can be unbounded. So which it it?
On the other hand, looking at your nice new plot, it seems to indicate that the RDMBS you're measuring does behave like an unbounded queue, b/c it goes asymptotic at about 2500 RPS. If I assume that indication (fitted curve) is correct and apply Little's law at saturation, I calculate your mean service time to be about 0.0004 s. And that, indeed, seems to jive with your y-intercept. Of course, we could've seen this immediately if you'd plotted against the utilization rather that the request rate on the x-axis. (cf. Fig. 4.17 on p. 121 of PPQ2)
But you say, "an M/M/m queue doesn't fit the data all too well" which I now find puzzling. Your new plot has pretty much convinced me of the thing you were trying to unconvince me of.
To view this discussion on the web visit https://groups.google.com/d/msg/guerrilla-capacity-planning/-/j9AibcSdUWgJ.
To post to this group, send email to guerrilla-cap...@googlegroups.com.
To unsubscribe from this group, send email to guerrilla-capacity-...@googlegroups.com.
DrQ
On Wednesday, June 27, 2012 2:55:22 AM UTC-7, wouterdb wrote:
On Tue, Jun 26, 2012 at 5:57 PM, DrQ wrote:re: Plot. Vast improvement. Nice job. One tweak you might add is to note which model you are fitting against.Anyway, now we can get down to some brass tacks.Before launching off into various performance modeling exotica (like, nonlinear regression and overdriven demand), you need to convince yourself that the target model (i.e., M/M/m) even makes sense for an RDMBS. For example, I could take the position that any RDMBS can only have a finite number (N) of processes handing DB requests. In which case, the queue length is bounded by N. An open queueing model like M/M/m is not compatible with that assumption b/c there, the number of requests can be unbounded. So which it it?The number of concurrent request is bounded, but the server is configured so that we never hit that limit.How can I best model limited queue size?
On the other hand, looking at your nice new plot, it seems to indicate that the RDMBS you're measuring does behave like an unbounded queue, b/c it goes asymptotic at about 2500 RPS. If I assume that indication (fitted curve) is correct and apply Little's law at saturation, I calculate your mean service time to be about 0.0004 s. And that, indeed, seems to jive with your y-intercept. Of course, we could've seen this immediately if you'd plotted against the utilization rather that the request rate on the x-axis. (cf. Fig. 4.17 on p. 121 of PPQ2)New plot attached
df <- read.csv("~/Desktop/wouterdb/wdata")
m <- 2
mmm.fit <- nls(Rtime ~ S/(1-(b*Arate*S/m)^m), data=df, start=list(S=1e-4,b=1.0))
summary(mmm.fit)
plot(df,xlab="Arrival rate (RPS)",ylab="Response time (s)")
lines(df$Arate,predict(mmm.fit),col="blue")
title(main=paste(paste("Parametric M/M/",toString(m),sep=""),"Model of RDBMS Data"))
Done.

But you say, "an M/M/m queue doesn't fit the data all too well" which I now find puzzling. Your new plot has pretty much convinced me of the thing you were trying to unconvince me of.The plot fits quite well, but only because the request rate has been multiplied by 2.3. I know it works, but I don't see its real world meaning.I think a multiplier smaller than one would mean there is a delay station somewhere inside the server, which adds to the response time, but not to utilization.But what does a multiplier larger than one mean?
On Tuesday, June 26, 2012 5:49:11 AM UTC-7, wouterdb wrote:
I stand corrected, new graph attachedWhat I am trying to do is automatically determine the parameters of an M/M/m queue, given a set of measurements.In the example graph, the data is from a mysql database, executing a set of select queries.However, it turns out that an M/M/m queue doesn't fit the data all too well, so I added overdriven throughput (as in 'analyzing computer system performance with PDQ, 2e ed, p 381').I have two concrete questions about this:
- I was wondering if anyone else has ever tried to do automated parameter estimation before?
- How can I improve the closeness of fit of the model?
Wouter
is supposed to represent), but I can say this. It doesn't do your cause any favors to produce a plot with no labeled axes or legend of any kind. If you are doing science, rather than art, the reader shouldn't be left guessing what you are trying to convey. Otherwise, the response is likely to be a deafening silence.
On Apr 5, 11:04 pm, DrQ wrote:
To unsubscribe from this group, send email to guerrilla-capacity-planning+unsubs...@googlegroups.com.
To unsubscribe from this group, send email to guerrilla-capacity-planning+unsubs...@googlegroups.com.
To unsubscribe from this group, send email to guerrilla-capacity-planning+unsubs...@googlegroups.com.
To unsubscribe from this group, send email to guerrilla-capacity-planning+unsubs...@googlegroups.com.
For more options, visit this group at http://groups.google.com/group/guerrilla-capacity-planning?hl=en.
Wouter De Borger
To view this discussion on the web visit https://groups.google.com/d/msg/guerrilla-capacity-planning/-/CgBt_IKMmkcJ.
To post to this group, send email to guerrilla-cap...@googlegroups.com.
To unsubscribe from this group, send email to guerrilla-capacity-...@googlegroups.com.
DrQ
On Thursday, June 28, 2012 12:54:56 AM UTC-7, wouterdb wrote:
I've never considered R before, but I'll look into it ;-)
On the other hand, looking at your nice new plot, it seems to indicate that the RDMBS you're measuring does behave like an unbounded queue, b/c it goes asymptotic at about 2500 RPS. If I assume that indication (fitted curve) is correct and apply Little's law at saturation, I calculate your mean service time to be about 0.0004 s. And that, indeed, seems to jive with your y-intercept. Of course, we could've seen this immediately if you'd plotted against the utilization rather that the request rate on the x-axis. (cf. Fig. 4.17 on p. 121 of PPQ2)
To unsubscribe from this group, send email to guerrilla-capacity-planning+unsubs...@googlegroups.com.
For more options, visit this group at http://groups.google.com/group/guerrilla-capacity-planning?hl=en.
On Wednesday, June 27, 2012 2:55:22 AM UTC-7, wouterdb wrote:
On Tue, Jun 26, 2012 at 5:57 PM, DrQ wrote:re: Plot. Vast improvement. Nice job. One tweak you might add is to note which model you are fitting against.Anyway, now we can get down to some brass tacks.Before launching off into various performance modeling exotica (like, nonlinear regression and overdriven demand), you need to convince yourself that the target model (i.e., M/M/m) even makes sense for an RDMBS. For example, I could take the position that any RDMBS can only have a finite number (N) of processes handing DB requests. In which case, the queue length is bounded by N. An open queueing model like M/M/m is not compatible with that assumption b/c there, the number of requests can be unbounded. So which it it?The number of concurrent request is bounded, but the server is configured so that we never hit that limit.How can I best model limited queue size?
On the other hand, looking at your nice new plot, it seems to indicate that the RDMBS you're measuring does behave like an unbounded queue, b/c it goes asymptotic at about 2500 RPS. If I assume that indication (fitted curve) is correct and apply Little's law at saturation, I calculate your mean service time to be about 0.0004 s. And that, indeed, seems to jive with your y-intercept. Of course, we could've seen this immediately if you'd plotted against the utilization rather that the request rate on the x-axis. (cf. Fig. 4.17 on p. 121 of PPQ2)
To unsubscribe from this group, send email to guerrilla-capacity-planning+unsubs...@googlegroups.com.
For more options, visit this group at http://groups.google.com/group/guerrilla-capacity-planning?hl=en.
--
You received this message because you are subscribed to the Google Groups "Guerrilla Capacity Planning" group.
To view this discussion on the web visit https://groups.google.com/d/msg/guerrilla-capacity-planning/-/CgBt_IKMmkcJ.
Wouter De Borger
The person who built the sensor has had an appendectomy last week, and is unavailable. So I can't give you the exact tolerances.
The overall setup is that a mysql proxy captures all traffic. (http://downloads.mysql.com/docs/mysql-proxy-en.pdf, page 33). For each query, a record is created with start time and duration. The records are grouped per second. For each second the number of requests and average response time are calculated. These are emitted to a opentsdb server. The opentsdb server makes one minute averages of these numbers.
The digits are not all significant. I'll send the exact accuracy once my colleague has recovered.
I think the time measurement has at least millisecond accuracy. Most likely even micro seconds. I don't exactly know how the post processing (per second bucketing and per minute averaging) influences the accuracy/confidence interval. I assume that the accuracy remains the same for response time. The request rate is a count, which is exact. The time measurements for bucketing are not, I think they have millisecond accuracy. I assume this would give an error of two times 1 ms on a one minute interval. I tried to work out what this would mean for the request rate, but I failed utterly.
B.
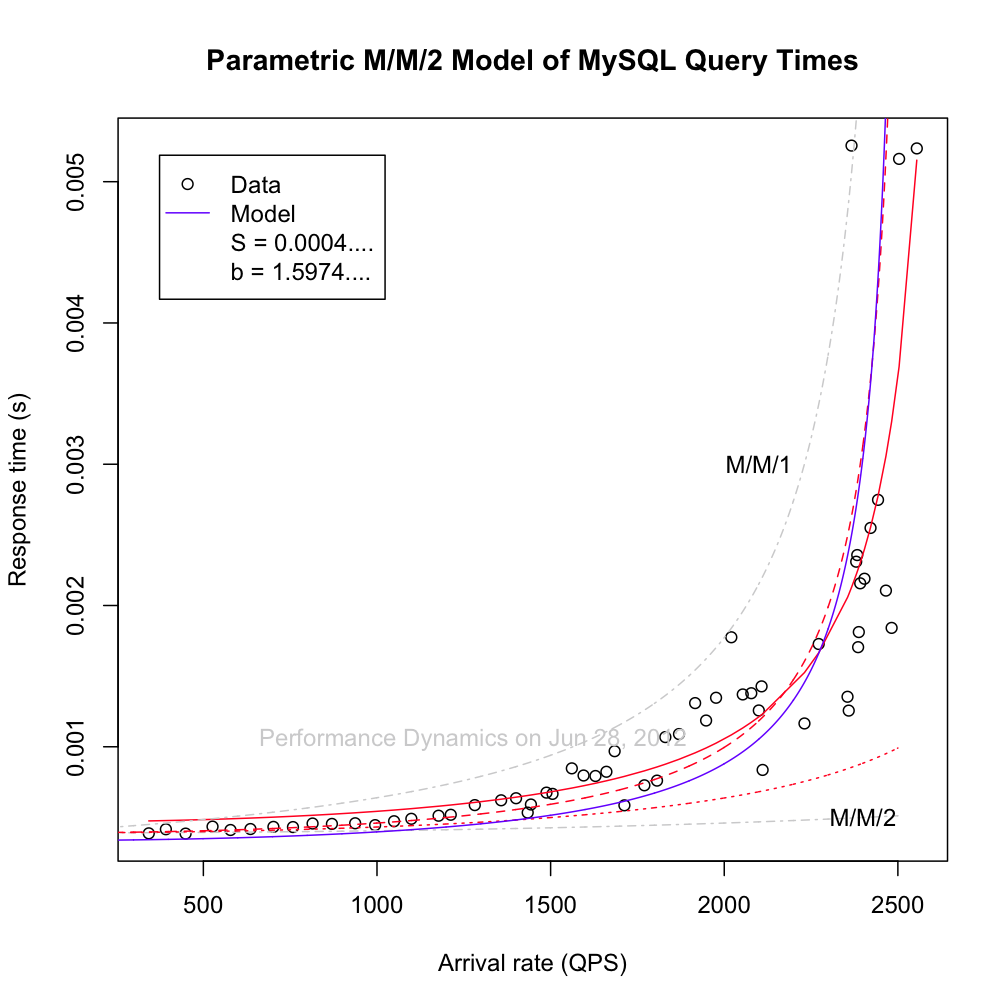
C. I introduced the param B so I had three independent tuning parameters:
S = intersect with the y axis
m for the sharpness of the curve
b to move the asymptote (arate = m/Sb)

In this plot, the red line is my model (fitted with R): Rtime ~ S/(1-(b*Arate*S/m)^m), (S=4.674e-04 and b=1.597)
the blue line is Rtime ~ S/(1 - (Arate * S/m)^m) , (S=0.0001525, m=0.4236660)
the green line is Rtime ~ S/(1 - (Arate * S)^m), (S=3.718e-04,m=1.476)
It seems that fractional servers work really well in the exponent, but not as well in the utilisation.
So I lost one parameter while only getting a marginally worse fit, which is great. So now the problem is: why only in the exponent?
Wouter
PS: R is really cool, thanks for the hint
To view this discussion on the web visit https://groups.google.com/d/msg/guerrilla-capacity-planning/-/vTZRjZZKrJ0J.
To post to this group, send email to guerrilla-cap...@googlegroups.com.
To unsubscribe from this group, send email to guerrilla-capacity-...@googlegroups.com.