If the Scheduler worked right (and it doesn't)...

Brandon Wirtz
If the Scheduler worked “right” it would take the number of Queries per second over 15 minutes (the minimum billing interval), and the average time to for an instance to fill a query, You divide one in to the other, add 1 Idle instance, Plus 1 instance for every interval of Wait the administrator has requested the max cue to be. That would be the number of instances it would spin up.
For example… Say you get 10 QPS and each request takes 500MS to fill.
Each instance can handle 2 QPS. The Number of QPS averages 10QPS, so you need 5 instances.
100 QPS , 1000 MS to fill, Administrator has requested no queue greater than 500ms
Yields
100 instances to cover the “load”
When all instances are “full” spin enough to get to 500 MS queue so add 50%
= 150 Instances
More optimized… You could assume that requests have a min and max time and follow a bell curve, and you’d only spin up 1 over 2.7 (or just 1/3 if that makes math easier)
As long as the load is pretty steady when averaged over some period of time, the scheduler shouldn’t ever have latencies that are Huge, nor should it have Lots of left over instances.
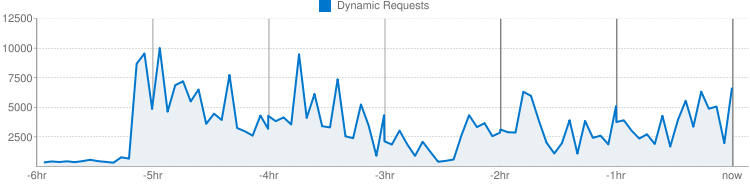
Green Line is QPS Blue is Total Instances, Orange is Active

You can see that the correlation is present, but it isn’t anywhere near what I would call “Strong”.
(all requests are pretty equal in this app in terms of what they do, and as you can see the “load” ranges from 6 qps to 12qps
For this app, the average Latency is 500 ms (+/- 10 ms)
So at 6 QPS if we could get all of the requests to have equal distribution, we’d need 3 instances to have 100% CPU Utilization in the instances. During the part of the day when the app is getting increasing requests, you’d hope that every time the latency crawled up to we will say 750ms (250MS queue time +500ms Fill time) that the app would spawn a new instance. When the Queue time fell to 0ms on 2 Instances, the scheduler would start the timer to kill an instance. If the equivalent of 2 instances were always free over 15 minutes, the Scheduler would kill an instance. I say Equivalent, because there is no reason to not use the instances during this time to keep queued tasks running faster if for example the total number of instances had fallen below the 8 instances that might be required to serve an http 1.1 request from a browser that would request 8 page resources at a time.
From the above graph you can see that isn’t what happens. The App Runs at 16-32 instances with less than 3 active. How less than 3 is active I’m not sure, I think that possibly instances are listed as inactive if they are waiting on an API call. (this is an assumption I don’t actually know).
Setting the Max Idle Instances shouldn’t have a major impact on the average latency if QPS is reasonably Steady, and more instances are in service than Simultaneous HTTP Requests are made. Idle instances should help smooth out the latency, but because the instance is alive for 15 minutes and the maximum latency is limited to 1/60th of that, the average shouldn’t be able to be more than 30x the Mean even if the scheduler only managed to do enough scheduling to make sure that no request timed out.
As such you can measure the efficiency of the scheduler as the Average Milliseconds / Request Observed (Fill plus Queue) vs the Average Milliseconds / Request without the Queue. (more simply the % of request time that the que takes up, but since we don’t have that metric on the dash board, this is what I can use)
I set max idle instances to 1 roughly 5 hours ago. (This is the same app and time frame as the graph above)
100% efficient would basically be the No Idle Instances and MS/Request being at the 500 level that it was 6 hours ago.

We see that setting 1 idle instance as a Max is ignored. Instead even after 5 hours the Idle instances is closer to 1 for every active (big improvement over the 5 to 1 it was 6 hours ago). And based on the MS/Request that requests are taking 5 times as long. So while the number of idle instances has fallen 4 to 1 the Time needed to serve a request has increased 4 fold.
Based on these numbers the scheduler would get an efficiency improvement in the negative range. It did save the user money, but either the numbers that are reported are inaccurate, there is a complexity to the billing that is not explained, or the optimization is truly a throttling mechanism, not a Speed vs Efficiency slider.
I am of the opinion that the way the Scheduler should work is that I’m adjusting the size of the line that I have.
If you go to the Walmart, each teller averages 2 minutes per customer. If you have 100 people in line, you can open 20 lines and the average wait will be a number less than 10 minutes. You can open 100 lines, but if you have to pay tellers in 15 minute increments you will have over paid by 1300 minutes.
The Ideal scenario is 200/15 or 13.333 tellers. Since you can’t have 13 and a third, you would say “is traffic going up or down?” if going up, we should have 14 tellers, we’ll need it in a minute. If it is going down, in a few minutes you would have 13 tellers.
The Sliders in the admin console should really be a Minimum QoS slider.
You have promised that you will open a new check out line whenever there are more than 3 people in the line ahead of the customer. With 100 Customers, that means 34 lines. That’s not Optimal from a CPU stand point, but it does limit the amount of time the customer stands in line.
Hopefully all of this is somewhat coherent. As I said it seems the Scheduler is a Throttle, not a Queue Manager. And that is not what anyone wants.
-Brandon

Rohan Chandiramani
+1

Jon McAlister
--
You received this message because you are subscribed to the Google Groups "Google App Engine" group.
To post to this group, send email to google-a...@googlegroups.com.
To unsubscribe from this group, send email to google-appengi...@googlegroups.com.
For more options, visit this group at http://groups.google.com/group/google-appengine?hl=en.
Jon McAlister
I've put together the following histogram from your last 7 hours
of logs. It evaluates the running time of requests once they
reach your instances. That is, pending latency is not shown here,
this is just the time it takes a request to process from once it
is picked up until it is completed.
total records: 260000
[ 0ms.. 100ms] = 172825
[ 100ms.. 200ms] = 21715
[ 200ms.. 300ms] = 9857
[ 300ms.. 400ms] = 5282
[ 400ms.. 500ms] = 2613
[ 500ms.. 600ms] = 1458
[ 600ms.. 700ms] = 829
[ 700ms.. 800ms] = 716
[ 800ms.. 900ms] = 949
[ 900ms.. 1000ms] = 1328
[ 1000ms.. 2000ms] = 20304
[ 2000ms.. 3000ms] = 11147
[ 3000ms.. 4000ms] = 3881
[ 4000ms.. 5000ms] = 2057
[ 5000ms.. 6000ms] = 1016
[ 6000ms.. 7000ms] = 1213
[ 7000ms.. 8000ms] = 806
[ 8000ms.. 9000ms] = 527
[ 9000ms..10000ms] = 1
[10000ms..11000ms] = 2
[11000ms..12000ms] = 1
[12000ms..13000ms] = 1
[13000ms..14000ms] = 1
[14000ms..15000ms] = 2
[15000ms..16000ms] = 268
[16000ms..17000ms] = 403
[17000ms..18000ms] = 226
[18000ms..19000ms] = 71
[19000ms..20000ms] = 43
[20000ms..21000ms] = 15
[21000ms..22000ms] = 11
[22000ms..23000ms] = 10
[23000ms..24000ms] = 44
[24000ms..25000ms] = 17
[25000ms..26000ms] = 0
[26000ms..27000ms] = 0
[27000ms..28000ms] = 0
[28000ms..29000ms] = 0
[29000ms..30000ms] = 0
While the mean serving latency for this app is 300ms (again,
completely ignoring pending time), note that very few requests
actually take anywhere near 300ms. Instead the distribution here
has the following characteristics:
- 66% of requests complete it under 100ms
- 15% of requests take between 800ms and 5000ms
- 0.345% of requests take between 15000ms and 18000ms
As such, this is not a simple distribution, or even a bell curve
or zipf curve, it's a tripolar distribution. The 15% pole at
800ms..5000ms in particular ends up dominating the scheduler
behavior for your app.
This is not surprising given that the app is, afaict, a web cache
proxy.
While I agree with your characterization that an ideal scheduler
would use qps/latency instances, I would have to add that this
can only be achieved with an ideal request stream. And by that, I
mean requests come in perfectly regular, and each takes exactly
the same running time. This is not the case with this app.
The more irregular the request stream, the farther away from the
ideal qps/latency formula we have to go to understand it.
And indeed, that's what is happening here. I've watched your app
for awhile now, and what I regularly see is that 3-5 of the long
requests (i.e. those from the 15% 800ms..5000ms pole) are running
at the same time, consequently occupying 3-5 instances [and
excluding them from being otherwise used]. During that time, 50
to 250 pending requests accumulate in your pending queue. If the
number of pending requests gets very large (enough to exceed the
15s max-pending-latency setting), it will trigger a new instance
to be created. Excess idle instances are then periodically killed
off, the app is in a state of back-and-forth between creating and
killing instances.
For an app with such a request latency distribution, you are
going to get the effects that you have correctly
observed. Attempts to constrain it to very few instances will
result in high pending latencies. To have low pending latencies,
many instances are needed, in order to handle the [800ms..5000ms]
requests.
What you really need here are concurrent requests. I strongly
advise you to sign up for the Python 2.7 trusted tester program:
http://groups.google.com/group/google-appengine-python/browse_thread/thread/4bde29d8e6dc0842?pli=1,
as that will make the biggest impact for you.
I hope that helps,
Jon
>> You can see that the correlation is present, but it isn’t anywhere near what I would call “Strong”.
>>
>> (all requests are pretty equal in this app in terms of what they do, and as you can see the “load” ranges from 6 qps to 12qps
>>
>>
>>
>> For this app, the average Latency is 500 ms (+/- 10 ms)
>>
>>
>>
>> So at 6 QPS if we could get all of the requests to have equal distribution, we’d need 3 instances to have 100% CPU Utilization in the instances. During the part of the day when the app is getting increasing requests, you’d hope that every time the latency crawled up to we will say 750ms (250MS queue time +500ms Fill time) that the app would spawn a new instance. When the Queue time fell to 0ms on 2 Instances, the scheduler would start the timer to kill an instance. If the equivalent of 2 instances were always free over 15 minutes, the Scheduler would kill an instance. I say Equivalent, because there is no reason to not use the instances during this time to keep queued tasks running faster if for example the total number of instances had fallen below the 8 instances that might be required to serve an http 1.1 request from a browser that would request 8 page resources at a time.
>>
>>
>>
>> From the above graph you can see that isn’t what happens. The App Runs at 16-32 instances with less than 3 active. How less than 3 is active I’m not sure, I think that possibly instances are listed as inactive if they are waiting on an API call. (this is an assumption I don’t actually know).
>>
>>
>>
>> Setting the Max Idle Instances shouldn’t have a major impact on the average latency if QPS is reasonably Steady, and more instances are in service than Simultaneous HTTP Requests are made. Idle instances should help smooth out the latency, but because the instance is alive for 15 minutes and the maximum latency is limited to 1/60th of that, the average shouldn’t be able to be more than 30x the Mean even if the scheduler only managed to do enough scheduling to make sure that no request timed out.
>>
>>
>>
>> As such you can measure the efficiency of the scheduler as the Average Milliseconds / Request Observed (Fill plus Queue) vs the Average Milliseconds / Request without the Queue. (more simply the % of request time that the que takes up, but since we don’t have that metric on the dash board, this is what I can use)
>>
>>
>>
>> I set max idle instances to 1 roughly 5 hours ago. (This is the same app and time frame as the graph above)
>>
>>
>>
>> 100% efficient would basically be the No Idle Instances and MS/Request being at the 500 level that it was 6 hours ago.
>>
>>
>>
Brandon Wirtz
have signed up before. If I end up needing to do this for my customers as
well, I may contact you off list.
Sure, Cheat and have access to better diagnostics than I do :-).
I would still prefer a QoS rather than a scheduler. Saying I want to serve
x% of requests with a pending latency of y would likely not give me the most
control over price, but it would let me "SLA" for my clients.
-----Original Message-----
From: google-a...@googlegroups.com
[mailto:google-a...@googlegroups.com] On Behalf Of Jon McAlister
Sent: Friday, September 09, 2011 12:12 PM
To: google-a...@googlegroups.com
Subject: Re: [google-appengine] If the Scheduler worked right (and it
doesn't)...
Hi Brandon,
I've put together the following histogram from your last 7 hours of logs. It
Jon McAlister
> Filled the paperwork for the 2.7 I didn't know this was an option would
> have signed up before. If I end up needing to do this for my customers as
> well, I may contact you off list.
Great, I think it will make a big difference for you.
> Sure, Cheat and have access to better diagnostics than I do :-).
Heh. I actually used only public tools for this one. First, you can
download logs with
http://code.google.com/appengine/docs/python/tools/uploadinganapp.html#Downloading_Logs
(note, you'll want to use --include_all). I did that, grabbing 100MB,
and then wrote a simple python script to compute the above histogram
(fwiw, attached).
> I would still prefer a QoS rather than a scheduler. Saying I want to serve
> x% of requests with a pending latency of y would likely not give me the most
> control over price, but it would let me "SLA" for my clients.
That makes sense. If that was specified, the scheduler could iterate
based on such a setting and try to narrow in on the correct balance of
instances that meets it. It's not how the scheduler works now, but
it's a good idea.

