App Engine servers more expensive than VPS?

Adam Sah

Brandon Wirtz
What is the Sin coefficient for the pattern of traffic as expressed over what period?
Only half kidding.
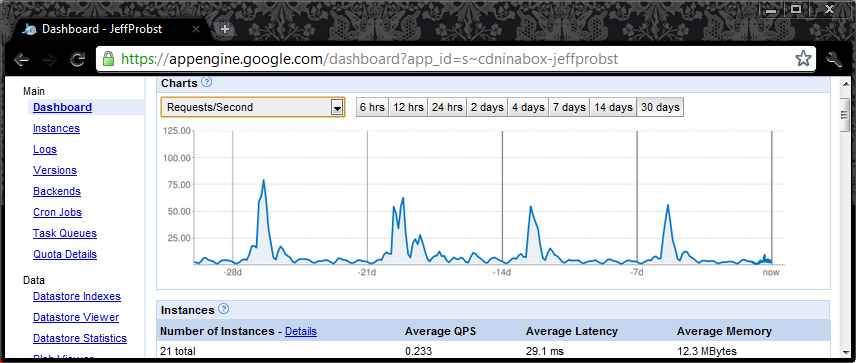
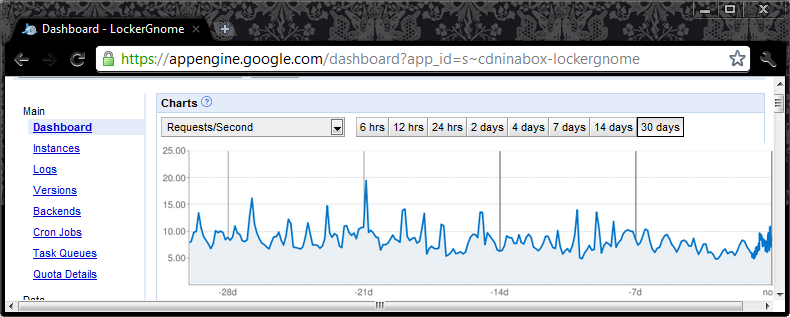
Both of these use about the same amount of traffic per month, but the first requires a lot more than one VPS is going to handle. (so is the second) but it is the peaks that cost money. If you could get all of your traffic to arrive on schedule in a perfectly flat usage pattern you’d save a crap load of money.
--
You received this message because you are subscribed to the Google Groups "Google App Engine" group.
To post to this group, send email to google-a...@googlegroups.com.
To unsubscribe from this group, send email to google-appengi...@googlegroups.com.
For more options, visit this group at http://groups.google.com/group/google-appengine?hl=en.

Greg
> - "appengine scales" -- is it really that hard to scale clusters of VPSs?
For a start, you suddenly need a minimum of four linode nodes: one
load balancer, one database, and two web servers. And you've got to
manage all those nodes, patching and upgrading them. Assuming you want
disaster recovery too, you need to set up the same infrastructure
(another 4 nodes) in a geographically distinct place, and figure out
how to keep data synced between them. Finally, if you hit the big time
and start needing more than one database server, you're in for a world
of hurt - replicating databases is a black art. Solving this problem
is why Oracle can charge hundreds of thousands for their systems.
OTOH, I agree with the thrust of your argument - the free ride is over
with Appengine. Basically it'll become too expensive for advertising-
supported apps, leaving only those with corporate IT budgets or
subscription models. Kind of ironic given how Google makes all their
money...
Brandon Wirtz
from, runs on at $50 a month Media Temple account and a $500 a month
CDNinaBox.com account. You won't be bigger then JeffProbst, and you could
likely run $50 media temple and $40 CDNInABox.com and have the control and
software compatibility of LAMP with all the GAE scale you would need.
Isn't compromise wonderful?
--

Stephen
>
> What is the Sin coefficient for the pattern of traffic as expressed over what period?
>
>
>
>
> Both of these use about the same amount of traffic per month, but the first requires a lot more than one VPS is going to handle. (so is the second) but it is the peaks that cost money. If you could get all of your traffic to arrive on schedule in a perfectly flat usage pattern you’d save a crap load of money.
What's great about current App Engine in the context of those graphs
is that everything happened automatically.
With the new price plan that is no longer the case. If you can predict
a week in advance how many instances you need, you pay only .05/IH
instead of .08/IH. What is the optimal number of reserved vs. demand
instance hours for your spiky traffic and your sinusoidal traffic
sites? How are you supposed to figure that out? You will have to
automate the calculation with some kind of predictive accounting
system, scraping data out of the App Engine console. There's a
business opportunity there for someone, unfortunately...
Instead of writing code to scale your website you need to write some
bullshit stock market-like adversarial accounting algorithm to fight
over 40% of your cost.
Stephen
> On May 11, 3:09 pm, Adam Sah <adam....@gmail.com> wrote:
>> - "appengine scales" -- is it really that hard to scale clusters of VPSs?
>
But is it worth the 12.9x price difference that Adam calculated?