geom_tile and PDF Output

Freddie Witherden
I am having an issue with geom_tile in that when my plot is saved as a
PDF (either directly, using pdf("..."), or through tikzdevice("..."))
that lines (or "striations") appear throughout the plot. I have
observed this behaviour on several PDF viewers and suspect it is due
to round off resulting in small gaps between tiles. These gaps allow
the background to bleed through.
This this looks somewhat awkward I am wondering if anyone knows of any
solutions? Ideally, one would have the geom_tile() layer rasterised
as a bitmap and then included as a raster as opposed to vector layer.
However, given that this does not currently seem to be implemented in
ggplo2 [1] I am open to other suggestions. Is there an easy way to
increase the size of all tile points such that they overlap? (Which
may be one of the simpler solutions.)
Regards, Freddie.
[1] See "Optimize pdf output size of geom_jitter "

Osmo Salomaa
assume you have set that to zero. If you still see lines of disturbing
width, you can explicitly draw those lines in the same color as you
fill the tiles, e.g.
ggplot(...)
+ geom_tile(aes(fill=z, color=z), size=0)
+ scale_fill_gradientn(...)
+ scale_color_gradientn(...)
where the two scale-calls have the same colors, breaks etc. This is
what I usually do and it works well enough.
And if you need to convert those PDFs to PNG or JPG, the DPI used for
that conversion will affect how visible those lines are in the raster
image, since the lines are probably as narrow as possible to render.
600 DPI can be significantly better than 300 DPI.
[1] http://had.co.nz/ggplot2/geom_tile.html
Freddie Witherden
> At least according to the docs [1] geom_tile has a default size=0.1. I
> assume you have set that to zero.
for my plotting and so do not believe that I am changing the size of
the tiles. It appears fine in the R preview pane (which uses X11Cairo
as the output device) -- just when saved as a PDF. Hence why I
suspect that the problems are roundoff related.
Regards, Freddie.

Dennis Murphy
to 2.14.0 *might* solve the problem. In those versions, the general
type of problem you're reporting here was reported by others on R-help
in various ways, covering base graphics, lattice and ggplot2.
Infelicities with some of the graphics devices was supposed to have
been fixed in 2.13.2 and 2.14.0, and in 2.14.0 some new graphics
devices were made available in conjunction with Cairo. See the NEWS
file of the latest R release for more details.
> --
> You received this message because you are subscribed to the ggplot2 mailing list.
> Please provide a reproducible example: http://gist.github.com/270442
>
> To post: email ggp...@googlegroups.com
> To unsubscribe: email ggplot2+u...@googlegroups.com
> More options: http://groups.google.com/group/ggplot2
>

baptiste auguie
introducing antialiasing artefacts when displaying many small tiles.
The only real workaround that I know of would be to make use of
rasterGrob instead of rectGrob -- for rectangular tiles only --, but
even that comes with its own share of pdf viewer infelicities as I
learned the hard way (try submitting a paper and telling your
coauthors+referees+editor that "it's your pdf viewer that's buggy, not
my graphic").
baptiste
Freddie Witherden
> Which version of R do you have? If it's 2.13.0 or 2.13.1, an upgrade
> to 2.14.0 *might* solve the problem. In those versions, the general
> type of problem you're reporting here was reported by others on R-help
> in various ways, covering base graphics, lattice and ggplot2.
> Infelicities with some of the graphics devices was supposed to have
I have just tried R 2.14 on my Mac (my Linux distribution is yet to
provide a package for 2.13). The result is the same.
Regards, Freddie.
Freddie Witherden
> Quite often the problem has been quoted to be related to pdf viewers
> introducing antialiasing artefacts when displaying many small tiles.
> The only real workaround that I know of would be to make use of
> rasterGrob instead of rectGrob -- for rectangular tiles only --, but
> even that comes with its own share of pdf viewer infelicities as I
> learned the hard way (try submitting a paper and telling your
> coauthors+referees+editor that "it's your pdf viewer that's buggy, not
> my graphic").
geom_tile? It seems as if I need to somehow first get the tiles as a
raster from R/ggplot2 and then composite that raster onto my plot
using rasterGlob. Is there a general procedure for this?
Regards, Freddie.

Winston Chang

Hadley Wickham
> end and start on exactly the same number, or is there a small numeric gap?
They're exactly the same.
Hadley
--
Assistant Professor / Dobelman Family Junior Chair
Department of Statistics / Rice University
http://had.co.nz/
Winston Chang
-Winston
Hadley Wickham
Hadley
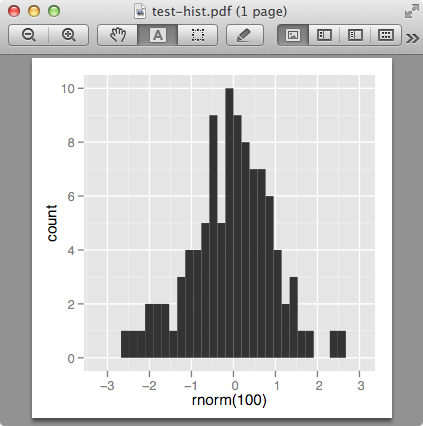
Zack Weinberg
>> For those who know the insides of ggplot2: do the x coordinates of the bars
>> end and start on exactly the same number, or is there a small numeric gap?
>
> They're exactly the same.
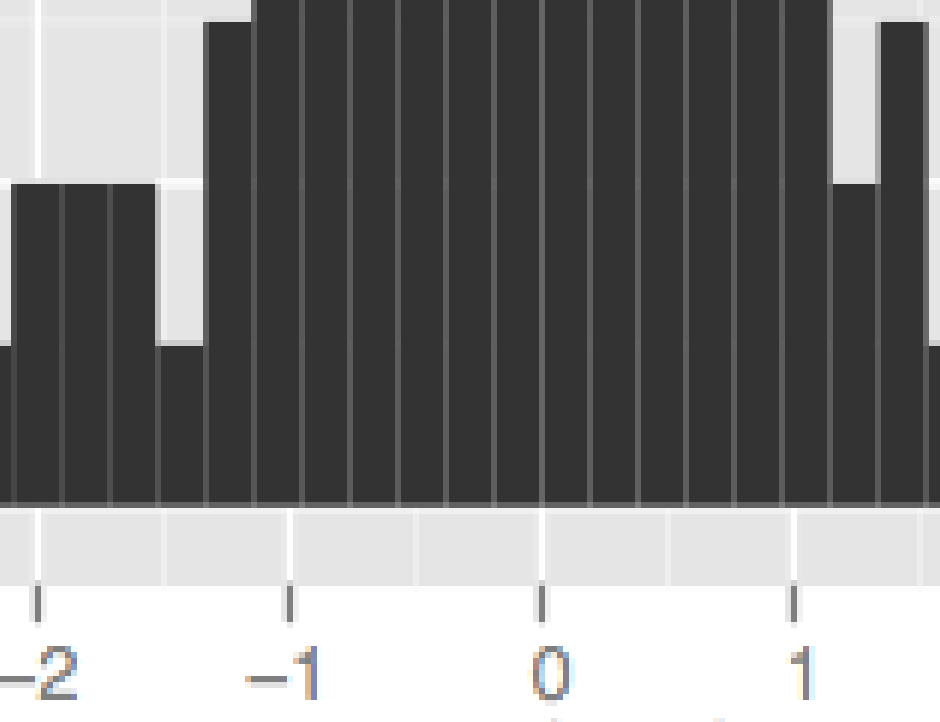
Part of the problem may be rounding error in the PDF device. This is
the portion of the PDF content stream that actually draws the bars:
51.79 48.02 6.40 0.00 re f
58.19 48.02 6.40 0.00 re f
64.59 48.02 6.40 0.00 re f
70.99 48.02 6.40 21.48 re f
77.39 48.02 6.40 21.48 re f
83.79 48.02 6.40 21.48 re f
90.19 48.02 6.40 42.97 re f
96.60 48.02 6.40 42.97 re f
103.00 48.02 6.40 42.97 re f
109.40 48.02 6.40 21.48 re f
115.80 48.02 6.40 64.45 re f
122.20 48.02 6.40 85.93 re f
128.60 48.02 6.40 85.93 re f
135.01 48.02 6.40 107.42 re f
141.41 48.02 6.40 193.35 re f
147.81 48.02 6.40 107.42 re f
154.21 48.02 6.40 214.83 re f
160.61 48.02 6.40 193.35 re f
167.01 48.02 6.40 171.87 re f
173.42 48.02 6.40 150.38 re f
179.82 48.02 6.40 150.38 re f
186.22 48.02 6.40 128.90 re f
192.62 48.02 6.40 85.93 re f
199.02 48.02 6.40 42.97 re f
205.42 48.02 6.40 64.45 re f
211.82 48.02 6.40 21.48 re f
218.23 48.02 6.40 21.48 re f
224.63 48.02 6.40 0.00 re f
231.03 48.02 6.40 0.00 re f
237.43 48.02 6.40 21.48 re f
243.83 48.02 6.40 21.48 re f
250.23 48.02 6.40 0.00 re f
256.64 48.02 6.40 0.00 re f
The 're' operator's four prefix arguments are x, y, w, h in that
order, and it draws a rectangle whose lower left-hand corner is at
(x,y) and upper right-hand corner is at (x+w, y+h). So to get no gap
between bars, the left-hand column should increment by exactly 6.40
each time, but you can see that sometimes it goes up by 6.41 instead.
However, when I correct that manually, I still get visible seams
between all the bars in my PDF reader (evince). So there's more
required. I don't especially want to dig through the PDF spec right
now and figure it out, though.
Freddie Witherden
> Part of the problem may be rounding error in the PDF device. This is
> the portion of the PDF content stream that actually draws the bars:
>
> The 're' operator's four prefix arguments are x, y, w, h in that
> order, and it draws a rectangle whose lower left-hand corner is at
> (x,y) and upper right-hand corner is at (x+w, y+h). So to get no gap
> between bars, the left-hand column should increment by exactly 6.40
> each time, but you can see that sometimes it goes up by 6.41 instead.
>
> However, when I correct that manually, I still get visible seams
> between all the bars in my PDF reader (evince). So there's more
> required. I don't especially want to dig through the PDF spec right
> now and figure it out, though.
increasing the width of each rectangle. So long as there is a bit of
overlap my understanding is that there should be no gaps.
Regards, Freddie.
Winston Chang

Joey Harrison

Adriano Fantini
--
--
You received this message because you are subscribed to the ggplot2 mailing list.
Please provide a reproducible example: https://github.com/hadley/devtools/wiki/Reproducibility
To post: email ggp...@googlegroups.com
To unsubscribe: email ggplot2+u...@googlegroups.com
More options: http://groups.google.com/group/ggplot2
---
You received this message because you are subscribed to the Google Groups "ggplot2" group.
To unsubscribe from this group and stop receiving emails from it, send an email to ggplot2+u...@googlegroups.com.
For more options, visit https://groups.google.com/d/optout.

David Kahle
Joey Harrison
Joey Harrison
Joey Harrison

Crump, Ron
>Thanks for the response. I just tried setting useDingbats to false and it
>didn't make any difference.
in the PDF by manually setting the width and height values. I guess I¹m
just creating small overlaps between adjacent tiles.
This is a bit fiddly, but might do as a short term fix. I guess you need
to know the spacing (therefore width/height) of your values. If the tile
width and height are variable then I guess the aesthetic would be set and
provided with a multiplier (e.g. aes(width=w*1.02,height=h*1.02) ), or
something like that.
Ron.
pp <- function (n,r=4) {
x <- seq(-r*pi, r*pi, len=n)
df <- expand.grid(x=x, y=x)
df$r <- sqrt(df$x^2 + df$y^2)
df$z <- cos(df$r^2)*exp(-df$r/6)
df
}
p <- ggplot(pp(20), aes(x=x,y=y))
pdf('junk3.pdf')
p+geom_tile(aes(fill=z),width=1.355,height=1.355)+coord_fixed()
dev.off()