fill pattern of barchart as "coarse hatching pattern".
3,225 views
Skip to first unread message

Jone Wy
Dec 1, 2009, 12:24:51 PM12/1/09
to ggplot2
Previously, I used the pure black as the filling in the bar chart as
required by one journal.
b1<-ggplot(temp2,aes(fvar,rel.inf))+stat_bin(fill="black")
However, some journal, such as Nature, require the "coarse hatching
pattern rather than shading or tints in graphs".
I could not find the other fill options through ggplot2 book or online
resources in Hadley's website. Please help me on this issue.
Thank you very much.

baptiste auguie
Dec 1, 2009, 4:12:31 PM12/1/09
to Jone Wy, ggplot2
Hi,
There was a discussion on this subject here some time ago, I think the
conclusion was that since Grid graphics do not provide filling
patterns for polygons it is currently not possible to do this in
ggplot2. However, you might like to hear of the very recent addition
of grid.raster() to the development version of R (*), which might help
in filling barplots with more freedom in the future. A basic example
adapted from Paul Murrell's follows,
library(grid)
# create a pattern
x11(width=4, height=4)
grid.grill(h = seq(0, 1, length=50), v = seq(0, 1, length=50),
vp=viewport(angle=45))
# capture it as a bitmap
hatch <- grid.cap()
dev.off()
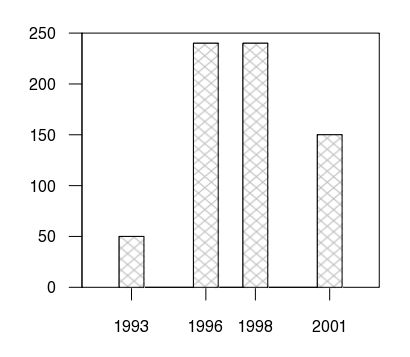
# now draw the barplot
year <- c(1993, 1996, 1998, 2001)
minpop <- c(20, 50, 50, 115)
maxpop <- c(50, 240, 240, 150)
grid.newpage()
pushViewport(plotViewport(),
viewport(xscale=c(1991, 2003), yscale=c(0, 250)))
grid.xaxis(at=year)
grid.yaxis()
grid.rect()
# white bars
grid.rect(x=unit(year, "native"), y=0,
width=unit(1, "native"), height=unit(maxpop, "native"),
just="bottom", gp=gpar(fill="white"))
for (i in 1:length(year)) {
grid.clip(x=unit(year[i], "native"), y=0,
width=unit(1, "native"), height=unit(maxpop[i], "native"),
just="bottom")
# pattern fill
grid.raster(hatch, width=1.5, height=1.5)
}
grid.clip()
# redo bar borders
grid.rect(x=unit(year, "native"), y=0,
width=unit(1, "native"), height=unit(maxpop, "native"),
just="bottom", gp=gpar(fill=NA))
popViewport(2)
grid.clip()
With enough motivation it might just be possible to hack a geom for
ggplot2 that uses this grid.clip() trick.
(*) : http://developer.r-project.org/Raster/raster-RFC.html where this
example was taken.
Best,
baptiste
> --
> You received this message because you are subscribed to the ggplot2 mailing list.
> To post to this group, send email to ggp...@googlegroups.com
> To unsubscribe from this group, send email to
> ggplot2+u...@googlegroups.com
> For more options, visit this group at
> http://groups.google.com/group/ggplot2
There was a discussion on this subject here some time ago, I think the
conclusion was that since Grid graphics do not provide filling
patterns for polygons it is currently not possible to do this in
ggplot2. However, you might like to hear of the very recent addition
of grid.raster() to the development version of R (*), which might help
in filling barplots with more freedom in the future. A basic example
adapted from Paul Murrell's follows,
library(grid)
# create a pattern
x11(width=4, height=4)
grid.grill(h = seq(0, 1, length=50), v = seq(0, 1, length=50),
vp=viewport(angle=45))
# capture it as a bitmap
hatch <- grid.cap()
dev.off()
# now draw the barplot
year <- c(1993, 1996, 1998, 2001)
minpop <- c(20, 50, 50, 115)
maxpop <- c(50, 240, 240, 150)
grid.newpage()
pushViewport(plotViewport(),
viewport(xscale=c(1991, 2003), yscale=c(0, 250)))
grid.xaxis(at=year)
grid.yaxis()
grid.rect()
# white bars
grid.rect(x=unit(year, "native"), y=0,
width=unit(1, "native"), height=unit(maxpop, "native"),
just="bottom", gp=gpar(fill="white"))
for (i in 1:length(year)) {
grid.clip(x=unit(year[i], "native"), y=0,
width=unit(1, "native"), height=unit(maxpop[i], "native"),
just="bottom")
# pattern fill
grid.raster(hatch, width=1.5, height=1.5)
}
grid.clip()
# redo bar borders
grid.rect(x=unit(year, "native"), y=0,
width=unit(1, "native"), height=unit(maxpop, "native"),
just="bottom", gp=gpar(fill=NA))
popViewport(2)
grid.clip()
With enough motivation it might just be possible to hack a geom for
ggplot2 that uses this grid.clip() trick.
(*) : http://developer.r-project.org/Raster/raster-RFC.html where this
example was taken.
Best,
baptiste
> You received this message because you are subscribed to the ggplot2 mailing list.
> To post to this group, send email to ggp...@googlegroups.com
> To unsubscribe from this group, send email to
> ggplot2+u...@googlegroups.com
> For more options, visit this group at
> http://groups.google.com/group/ggplot2

hadley wickham
Dec 1, 2009, 4:18:09 PM12/1/09
to baptiste auguie, Jone Wy, ggplot2
> With enough motivation it might just be possible to hack a geom for
> ggplot2 that uses this grid.clip() trick.
If you did want to do this, I think that the path forward would be to
> ggplot2 that uses this grid.clip() trick.
develop a version of grid.rect that encapsulated all these details in
to a single fill argument. Do you know if grid.raster supports
tiling? It would make this task much easier.
Of course the next problem is coming up with a nice library of textures...
Hadley
--
http://had.co.nz/
baptiste auguie
Dec 1, 2009, 4:51:56 PM12/1/09
to hadley wickham, ggplot2
On Tue, Dec 1, 2009 at 10:18 PM, hadley wickham <h.wi...@gmail.com> wrote:
>> With enough motivation it might just be possible to hack a geom for
>> ggplot2 that uses this grid.clip() trick.
>
> If you did want to do this, I think that the path forward would be to
> develop a version of grid.rect that encapsulated all these details in
> to a single fill argument.
Agreed, that's also what I had in mind: a new grob (with grid.clip
>> With enough motivation it might just be possible to hack a geom for
>> ggplot2 that uses this grid.clip() trick.
>
> If you did want to do this, I think that the path forward would be to
> develop a version of grid.rect that encapsulated all these details in
> to a single fill argument.
probably buried in the drawDetails) with the following parameters,
hatchGrob(x, y, width, height, pattern, pattern.xoffset=0, pattern.yoffset=0,
name, gp, vp, default.units)
(but to be honest, I am not a great believer in filling patterns so I
probably won't try this further).
> Do you know if grid.raster supports
> tiling? It would make this task much easier.
would simply create a unit motif (e.g. a single brick) that is then
replicated periodically in all space (making a wall)? I don't think
this is the case, as far as I understand grid.raster simply displays a
matrix of colours in a more efficient way than grid.rect() but you
still need to specify the colour of each individual points (aside the
now possible interpolation).
>
> Of course the next problem is coming up with a nice library of textures...
You'd think that must have been studied already somewhere (base
graphics' histograms maybe?, or xfig <
http://www.xfig.org/userman/fig-format.html >). For a quick try it
would just be a case of importing bitmap graphics (EBImage) and saving
the raster textures. Eventually one would like to be able to generate
textures on-the-fly should the need arise (resolution problems, etc.).
Best,
baptiste
>
> Hadley
>
>
>
> --
> http://had.co.nz/
>
hadley wickham
Dec 1, 2009, 5:17:07 PM12/1/09
to baptiste auguie, ggplot2
>> Of course the next problem is coming up with a nice library of textures...
>
> That would be the nice part...
> You'd think that must have been studied already somewhere (base
> graphics' histograms maybe?, or xfig <
> http://www.xfig.org/userman/fig-format.html >). For a quick try it
> would just be a case of importing bitmap graphics (EBImage) and saving
> the raster textures. Eventually one would like to be able to generate
> textures on-the-fly should the need arise (resolution problems, etc.).
You would think so, but in my experience there has been little work
>
> That would be the nice part...
> You'd think that must have been studied already somewhere (base
> graphics' histograms maybe?, or xfig <
> http://www.xfig.org/userman/fig-format.html >). For a quick try it
> would just be a case of importing bitmap graphics (EBImage) and saving
> the raster textures. Eventually one would like to be able to generate
> textures on-the-fly should the need arise (resolution problems, etc.).
done on coming up with aesthetically pleasing and perceptual
distinctive shapes or line types or textures.
Hadley
--
http://had.co.nz/
baptiste auguie
Dec 3, 2009, 4:24:44 PM12/3/09
to hadley wickham, ggplot2
Hi,
A small update on the Grid aspect: I played a little with the idea of
tiling a raster motif and clipping it to a rectangle. The idea is as
follows: 1) create a motif and rasterize it with grid.cap; 2) make the
drawDetails method of the new grob to calculate how many repeats of
the motif are needed for a particular outline size; 3) clip the tiled
motif to the rectangular outline. This setup ensures that the user is
in control of the size of the motif and that this size is maintained
for different rectangle sizes (also works with dynamic resizing).
The code below works with R devel, though I ran into some weird
device-dependent problems (posted to R-dev). The working output is
attached.
Best,
baptiste
library(grid)
dots <- function(..., width=0.5, height=0.5){
x11(width=width, height=height)
grid.points(x=unit(0.5, "npc"), y=unit(0.5, "npc"), ...)
m <- grid.cap()
dev.off()
invisible(m)
}
.dots <- dots()
grid.raster(.dots)
plus <- function(..., width=0.5, height=0.5){
x11(width=width, height=height)
grid.points(x=unit(0.5, "npc"), y=unit(0.5, "npc"), pch="+",
gp=gpar(cex=3), ...)
m <- grid.cap()
dev.off()
invisible(m)
}
.plus <- plus()
grid.raster(.plus)
slash45 <- function(..., width=0.5, height=0.5){
x11(width=width, height=height)
grid.segments(...)
m <- grid.cap()
dev.off()
invisible(m)
}
.slash45 <- slash45()
grid.raster(.slash45)
bslash45 <- function(..., width=0.5, height=0.5){
x11(width=width, height=height)
grid.segments(0, 1, 1, 0, ...)
m <- grid.cap()
dev.off()
invisible(m)
}
.bslash45 <- bslash45()
grid.raster(.bslash45)
grid45 <- function(..., width=0.5, height=0.5){
x11(width=width, height=height)
grid.polygon(...)
m <- grid.cap()
dev.off()
invisible(m)
}
.grid45 <- grid45()
## grid.raster(.grid45)
tile.motif <- function(m, nx=10, ny=nx){
cols <- matrix(rep(m, nx), ncol=ncol(m)*nx, byrow=F)
matrix(rep(t(cols), ny), nrow=nrow(cols)*ny, byrow=T)
}
## quartz()
## grid.raster(tile.motif(.dots, 2, 3))
## grid.raster(tile.motif(.grid45, 2, 3))
## grid.raster(tile.motif(.slash45, 2, 3))
## grid.raster(tile.motif(.bslash45, 2, 3))
patternGrob <- function(x=unit(0.5, "npc"), y=unit(0.5, "npc"),
width=unit(1, "npc"), height=unit(1, "npc"),
motif=matrix("white"), AR=1,
motif.width=unit(5, "mm"),
motif.height=AR*motif.width,
pattern.offset=c(0, 0), # unimplemented
default.units="npc",
clip=TRUE, gp=gpar(fill=NA), ...)
{
grob(x=x, y=y, width=width, height=height,
motif=motif, motif.width=motif.width,
motif.height=motif.height, clip=clip, gp=gp, ..., cl="pattern")
}
widthDetails.pattern <- function(x) x$width
heightDetails.pattern <- function(x) x$height
drawDetails.pattern <- function(x, recording=TRUE){
## calculate the number of tiles
nx <- ceiling(convertUnit(x$width, "in", value=TRUE) /
convertUnit(x$motif.width, "in", value=TRUE)) + 1
ny <- ceiling(convertUnit(x$height, "in", axisFrom = "y", value=TRUE) /
convertUnit(x$motif.height, "in", axisFrom = "y",
value=TRUE)) + 1
width <- convertUnit(x$width, "in")
height <- convertUnit(x$height, "in", axisFrom = "y")
## clip the raster
pushViewport(viewport(x=x$x, y=x$y,
width=x$width, height=x$height, clip=x$clip))
grid.raster(tile.motif(x$motif, nx, ny), width=nx*x$motif.width,
height=ny*x$motif.height)
upViewport()
## overlay the rectangle
grid.rect(x=x$x, y=x$y,
width=x$width, height=x$height,
just="center", gp=x$gp)
}
g1 <- patternGrob(x=0.2, y=0.1, width=unit(0.2, "npc"),
height=unit(0.1, "npc"),
clip=TRUE, motif=.dots)
g2 <- patternGrob(x=0.7, width=unit(3.7, "cm"),
height=unit(5.2, "cm"),
clip=TRUE, motif=.grid45)
g3 <- patternGrob(x=0.2, width=unit(0.2, "npc"),
height=unit(2.3, "cm"),
clip=TRUE, motif=.slash45)
g4 <- patternGrob(x=0.7, y=0.1, width=unit(2, "in"),
gp=gpar(fill=NA, col="blue", lwd=2),
height=unit(0.1, "npc"), AR=3,
clip=TRUE, motif=.bslash45)
g5 <- patternGrob(x=0.5, y=0.8, width=unit(1, "npc"),
gp=gpar(fill=NA, col="blue", lwd=2),
height=unit(0.1, "npc"),
clip=TRUE, motif=.plus)
quartz()
grid.newpage()
lapply(ls(pattern="g[[:digit:]]"), function(g) grid.draw(get(g)))
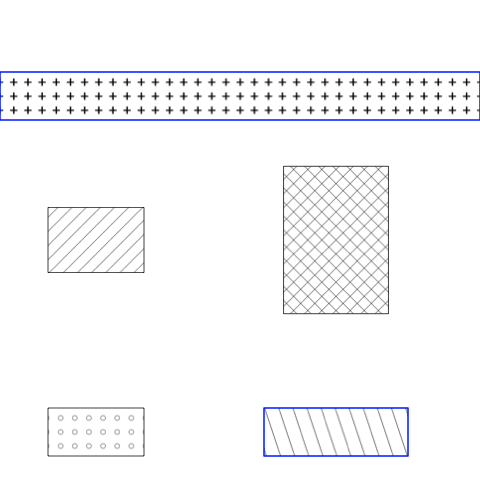
baptiste auguie
Dec 4, 2009, 9:24:43 AM12/4/09
to hadley wickham, ggplot2
overview of textures. They might differ in i) granularity (spacing
between marks), ii) pattern (dots or lines, etc), iii) orientation
(tilt of the lines).
From this table, I have the impression that:
1- for filling patterns as for linetypes and point shapes there is
only a limited choice of variants, and only a few of them can ever be
distinguished in a given plot.
2- considering 1- and the lack of literature regarding which patterns
are good or bad (visual artifacts and ease to distinguish), I think
one should settle for a small set (maybe 5 to 7 max) of widely used
patterns. To me this is the same problem as for the default linetypes
and point shapes in base R: they remain dictated by publication
habits, until a real cognitive study can be found.
Another question that may arise is what should happen when two objects
overlap? Should the two patterns mix or remain in opaque layers?
hadley wickham
Dec 6, 2009, 7:07:33 PM12/6/09
to baptiste auguie, ggplot2
> page 317, table 10.2 of Wilkinson's Grammar of graphics presents an
> overview of textures. They might differ in i) granularity (spacing
> between marks), ii) pattern (dots or lines, etc), iii) orientation
> (tilt of the lines).
I had forgotten about that - thanks for the reminder!
> overview of textures. They might differ in i) granularity (spacing
> between marks), ii) pattern (dots or lines, etc), iii) orientation
> (tilt of the lines).
> From this table, I have the impression that:
>
> 1- for filling patterns as for linetypes and point shapes there is
> only a limited choice of variants, and only a few of them can ever be
> distinguished in a given plot.
>
> 2- considering 1- and the lack of literature regarding which patterns
> are good or bad (visual artifacts and ease to distinguish), I think
> one should settle for a small set (maybe 5 to 7 max) of widely used
> patterns. To me this is the same problem as for the default linetypes
> and point shapes in base R: they remain dictated by publication
> habits, until a real cognitive study can be found.
perceptual studies along these lines. Unfortunately I don't have any
experience designing this type of experiment, so I might be stumbling
in the dark for a while.
> Another question that may arise is what should happen when two objects
> overlap? Should the two patterns mix or remain in opaque layers?
then yes, otherwise no.
--
http://had.co.nz/

JiHO
Dec 6, 2009, 7:54:06 PM12/6/09
to baptiste auguie, Jone Wy, ggplot2
On Tue, Dec 1, 2009 at 22:12, baptiste auguie <bapt...@googlemail.com> wrote:
> However, you might like to hear of the very recent addition
> of grid.raster() to the development version of R (*), which might help
> in filling barplots with more freedom in the future
while this could indeed be a way forward, the name and the output
> However, you might like to hear of the very recent addition
> of grid.raster() to the development version of R (*), which might help
> in filling barplots with more freedom in the future
seems to indicate that this is all raster patterns. It will be nice to
paint histogram bars in marble or wood textures (which some people do
like, Apple Keynote is a sad proof of that) but it won't give scalable
lines/points for PDF output would it?
JiHO
---
http://maururu.net
baptiste auguie
Dec 7, 2009, 5:03:53 AM12/7/09
to JiHO, ggplot2
Hi,
grid.raster is indeed a raster format and won't scale like a vector
format when you zoom in. It is possible to make a vector filling
pattern for rectangles in R, but to me it makes more sense to use this
new raster function. Unlike data and text, I see no gain in having a
scale-independent output for patterns, quite the contrary in fact.
1- If you use a raster output format, it won't make any difference anyway.
2- If you edit the pdf with, e.g. Illustrator, the pattern is one
single object with a clipping attribute, not a group of many small
points/lines. It seems more suited to the task.
3- The file size would be much smaller than a fully vector output, and
it's presumably faster.
4- grid.raster is not like grid.rect: it can perform interpolation
between points, so you see a smoother output when zooming in. Granted
it's not sharp and scale-independent, but does it need to be?
5- No weird artifacts from pdf viewers.
6- as you mention, gradients and exotic textures can be used as well
as more classical tiling patterns.
In addition, I have the impression that such patterns are almost
intrinsically of absolute size. For instance, If I make an histogram
and I want the filling pattern to be little squares, I will need to
specify a sensible density for the pattern to be visible inside the
rectangles. If the motif has a given size (e.g. 5mm) it makes sense
to me to give it a good but finite resolution because it is designed
to be viewed at a given size. If I need to produce a very large
graphic for a poster or something, I would use a different motif size,
and then choose the resolution accordingly.
I guess it would be interesting to make a small example with both
techniques and gauge the respective advantages/drawbacks.
Best,
baptiste
JiHO
Dec 7, 2009, 5:20:03 AM12/7/09
to baptiste auguie, ggplot2
While all points are valid and I mostly agree with them, this one is
critical to me:
> 4- grid.raster is not like grid.rect: it can perform interpolation
> between points, so you see a smoother output when zooming in. Granted
> it's not sharp and scale-independent, but does it need to be?
a raster line will never look and more importantly print as sharply as
a vector line. So printing a rectangle filled with a raster pattern of
slanted lines for example will result in a sharp black boundary and
greyish inside lines. I am probably a bit anal about that but, to me,
it really make an important difference. To submit the plot the a paper
I would probably recreate the patterns in Inkscape a posteriori for
the sake of having it all vector (even if the print guys are often not
very good at their jobs, they tend to screw up vector plots less than
raster ones, in my little experience).
> In addition, I have the impression that such patterns are almost
> intrinsically of absolute size. For instance, If I make an histogram
> and I want the filling pattern to be little squares, I will need to
> specify a sensible density for the pattern to be visible inside the
> rectangles. If the motif has a given size (e.g. 5mm) it makes sense
> to me to give it a good but finite resolution because it is designed
> to be viewed at a given size. If I need to produce a very large
> graphic for a poster or something, I would use a different motif size,
> and then choose the resolution accordingly.
I would tend to suggest the contrary. Let say I have a bar chart with
such patterns which are spaced so that they look good for a 7x10cm
publication graph (probably a 1 pt line every ~1.5, 2 mm). If I want
to print this plot on a poster at size 20x30 cm I probably do not want
a thin line every 2mm. I more likely to need a 1.5mm line every 5-8
mm. So basically I want to take the PDF of my plot and scale it up,
including the pattern. For this, raster patterns would be
inappropriate.
JiHO
---
http://maururu.net
critical to me:
> 4- grid.raster is not like grid.rect: it can perform interpolation
> between points, so you see a smoother output when zooming in. Granted
> it's not sharp and scale-independent, but does it need to be?
a vector line. So printing a rectangle filled with a raster pattern of
slanted lines for example will result in a sharp black boundary and
greyish inside lines. I am probably a bit anal about that but, to me,
it really make an important difference. To submit the plot the a paper
I would probably recreate the patterns in Inkscape a posteriori for
the sake of having it all vector (even if the print guys are often not
very good at their jobs, they tend to screw up vector plots less than
raster ones, in my little experience).
> In addition, I have the impression that such patterns are almost
> intrinsically of absolute size. For instance, If I make an histogram
> and I want the filling pattern to be little squares, I will need to
> specify a sensible density for the pattern to be visible inside the
> rectangles. If the motif has a given size (e.g. 5mm) it makes sense
> to me to give it a good but finite resolution because it is designed
> to be viewed at a given size. If I need to produce a very large
> graphic for a poster or something, I would use a different motif size,
> and then choose the resolution accordingly.
such patterns which are spaced so that they look good for a 7x10cm
publication graph (probably a 1 pt line every ~1.5, 2 mm). If I want
to print this plot on a poster at size 20x30 cm I probably do not want
a thin line every 2mm. I more likely to need a 1.5mm line every 5-8
mm. So basically I want to take the PDF of my plot and scale it up,
including the pattern. For this, raster patterns would be
inappropriate.
JiHO
---
http://maururu.net
baptiste auguie
Dec 7, 2009, 5:45:58 AM12/7/09
to JiHO, ggplot2
I never really tested it but I was under the impression that given an
appropriate, high resolution, there was no difference in the print
output. That said, I also prefer pure vector formats as a general
rule. The gain just does not seem worth the price to pay here, but
again I think only a comparative example could tell.
Perhaps, but I am not completely sure that patterns should scale in
the same way as the rest of the plot (invariant density). They
probably should to some extent, in which case you're absolutely right.
Best,
baptiste
appropriate, high resolution, there was no difference in the print
output. That said, I also prefer pure vector formats as a general
rule. The gain just does not seem worth the price to pay here, but
again I think only a comparative example could tell.
the same way as the rest of the plot (invariant density). They
probably should to some extent, in which case you're absolutely right.
Best,
baptiste
baptiste auguie
Dec 7, 2009, 8:46:51 AM12/7/09
to JiHO, ggplot2
An experimental vector pattern is attached, together with a comparison
between vector and raster. I have to admit, the vector output is much
better! So much for my preconceived ideas.
One thing that is more difficult to do than with grid.raster is to
tile a motif. It's OK for grid.points, but grid.segments (for slanted
lines, etc.) would require a completely different code... I think the
best way to deal with this problem would be to create an intermediate
function that calls whichever primitive grob with appropriate
parameters.
Cheers,
baptiste
Mike Lawrence
Dec 7, 2009, 10:06:28 AM12/7/09
to hadley wickham, baptiste auguie, ggplot2
On Sun, Dec 6, 2009 at 8:07 PM, hadley wickham <h.wi...@gmail.com> wrote:
> I'm hoping I can find a student interested in doing some small
> perceptual studies along these lines. Unfortunately I don't have any
> experience designing this type of experiment, so I might be stumbling
> in the dark for a while.
I just tuned into this thread. I have a background in psychophysics
> I'm hoping I can find a student interested in doing some small
> perceptual studies along these lines. Unfortunately I don't have any
> experience designing this type of experiment, so I might be stumbling
> in the dark for a while.
and my lab has recently gotten into empirical tests of aesthetic
design choices, so I could certainly help with experimental design if
you get an interested student. Unfortuantely my dissertation has me
sufficiently busy that I would not be able to take the lead myself.
I'll ask my design colleague if he has any students that might find
this of interest.
--
Mike Lawrence
Graduate Student
Department of Psychology
Dalhousie University
Looking to arrange a meeting? Check my public calendar:
http://tr.im/mikes_public_calendar
~ Certainty is folly... I think. ~
baptiste auguie
Dec 7, 2009, 2:29:26 PM12/7/09
to ggplot2
I played a bit more with the vector pattern, one can now specify
points or lines. My main concern now is that "grid.vpattern" is not
vectorized(*) like grid.rect or grid.points, etc. Of course one can
remedy this with Vectorize but I'm a bit worried about the efficiency.
Do you know other examples of grid functions that are not vectorized?
(*) the other kind of vector if you follow me!
## example below, try resizing the window
library(grid)
source("http://gridextra.googlecode.com/svn/trunk/R/vpattern.r")
grid.newpage()
grid.vpattern(width=unit(3,"cm"), height=unit(0.5,"npc"),
motif="points", motif.params=list(pch=2,
gp=gpar(cex=0.5)), clip=T)
grid.newpage()
grid.vpattern(width=unit(0.3,"npc"), height=unit(0.5,"npc"),
motif="segments", motif.params=list(angle=45))
grid.newpage()
grid.vpattern(width=unit(3,"cm"), height=unit(5,"cm"),
motif="segments", motif.params=list(angle=-45))
Cheers,
baptiste
Reply all
Reply to author
Forward
0 new messages