Chemical structures in ggplot2
151 views
Skip to first unread message

sebastia...@basf.com
Oct 29, 2009, 4:58:44 AM10/29/09
to ggp...@googlegroups.com
Before starting to hack something myself, I would like to ask the list:
Is there any mechanism of drawing chemical structures (e.g. as axis labels or plot / facet titles) in ggplot2? This would be a really great feature for all of us who do data analysis in the life sciences...
Does anybody have experience with displaying chemical structures in R?
Thanks a lot,
Sebastian

baptiste auguie
Oct 29, 2009, 3:30:03 PM10/29/09
to sebastia...@basf.com, ggp...@googlegroups.com
Hi,
Interesting idea, I'd be keen to hear about an R package to draw
chemical structures.
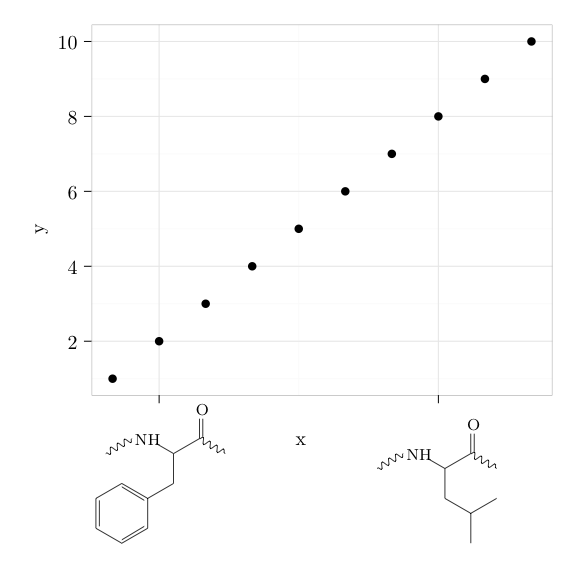
One possible hack is to use the tikzDevice package that lets you use
arbitrary LaTeX code in a plot, which is subsequently processed by
LaTeX (similar to psfrag in this regard). I found a small LaTeX
package with chemical macros, and with a little tweaking of the
margins you can get a decent result,
options(tikzLatexPackages =
c(getOption('tikzLatexPackages'),"\\usepackage{acide-amine}\n"))
d = data.frame(x=1:10, y=1:10, f=factor(sample(letters[1:2], 10, repl=TRUE)))
p <- qplot(x,y,data=d) + theme_bw() +
opts(plot.margin = unit(c(1, 1, 5, 1), "lines"),
axis.text.x = theme_text(size = 12 *
0.8, lineheight = 0.9, vjust = 10)) +
scale_x_continuous(breaks = c(2, 8), labels=c("\\phe{15}", "\\leu{15}"))
tikz("annotation.tex",standAlone=T,width=4,height=4)
print(p)
dev.off()
(output attached)
HTH,
baptiste
Interesting idea, I'd be keen to hear about an R package to draw
chemical structures.
One possible hack is to use the tikzDevice package that lets you use
arbitrary LaTeX code in a plot, which is subsequently processed by
LaTeX (similar to psfrag in this regard). I found a small LaTeX
package with chemical macros, and with a little tweaking of the
margins you can get a decent result,
options(tikzLatexPackages =
c(getOption('tikzLatexPackages'),"\\usepackage{acide-amine}\n"))
d = data.frame(x=1:10, y=1:10, f=factor(sample(letters[1:2], 10, repl=TRUE)))
p <- qplot(x,y,data=d) + theme_bw() +
opts(plot.margin = unit(c(1, 1, 5, 1), "lines"),
axis.text.x = theme_text(size = 12 *
0.8, lineheight = 0.9, vjust = 10)) +
scale_x_continuous(breaks = c(2, 8), labels=c("\\phe{15}", "\\leu{15}"))
tikz("annotation.tex",standAlone=T,width=4,height=4)
print(p)
dev.off()
(output attached)
HTH,
baptiste
Reply all
Reply to author
Forward
0 new messages