Layers package

Hadley Wickham
I wanted to point you all to the layers package,
https://github.com/hadley/layers, where I'm experimenting with the
future implementation of geoms, stats, position adjustments (adjusts)
and layers for ggplot2. Layers is currently a separate package so I
can experiment with the best interface without the baggage of the
existing ggplot2 implementation, but it will eventually be integrated
back into ggplot2 (definitely by 1.0).
The main aim is to improve the implementation of these important
ggplot2 objects:
* switching from proto to S3
* documenting the generics
* splitting out big complicated methods into smaller simpler methods
* using a more efficient data structure (lists instead of data frames)
* making them easier to test
* making them easier to document
and generally making it easier to create new geoms, stats and adjusts.
Currently, only the interface for geoms is developed enough for
feedback, so if you're interested, I'd really appreciate your comments
on the design. Start with geom.r, reading the source code for
geom_plot to understand the basic sequence of method calls, then read
the documentation for the generics, and the implementations of various
geoms in geom-*.r
The definition of geoms is a bit cleaner in layers - geom_bar really
represents a bar geometric object, not a layer that uses geom_bar,
stat_identity and position_identity. I'm not sure how this will end up
in ggplot2, but eventually I would like to replace (e.g.)
geom_histogram with layer_histogram, reserving geoms for real
geometric objects. I don't see an easy way to do this without breaking
a large amount of existing code, so there will either be a length
period where both work, or I'll have to make ggplot3 :/
Hadley
--
Assistant Professor / Dobelman Family Junior Chair
Department of Statistics / Rice University
http://had.co.nz/
baptiste auguie
I really like where this is going (S3), thanks!
One question, now that the code is spread across several packages,
with new names and conventions: have you got a diagrammatic
representation of the main functions in each package, the sequence of
calls, and their interactions? I think such an atlas would be quite
useful.
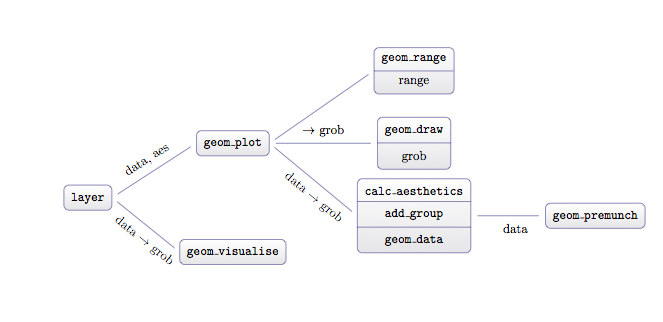
I attach a minimal tikz skeleton to illustrate the idea for the layer
package (as far as I got, anyway), I'd be happy to pursue it further
if you haven't made one already.
Cheers,
baptiste
Hadley Wickham
> with new names and conventions: have you got a diagrammatic
> representation of the main functions in each package, the sequence of
> calls, and their interactions? I think such an atlas would be quite
> useful.
No, mainly because I'm not sure it's useful at this point - there's a
lot still in flux. But one of the advantages of these smaller
packages is that each can illustrate the essence of how each component
should work - you can see this with cscale and dscale in scales, and
geom_plot in geom. Hopefully those functions allow you to see how all
the pieces should fit together, without all the extra complexity
that's needed in ggplot2.
> I attach a minimal tikz skeleton to illustrate the idea for the layer
> package (as far as I got, anyway), I'd be happy to pursue it further
> if you haven't made one already.
I like the idea of a skeleton diagram, but I have no idea how to
interpret that one. What do the arrows mean? What are the
annotations on the arrows? What do the different fonts in the boxes
represent? Plus I don't really see how layer connects to
geom_visualise - and in fact at this point, I wouldn't think about
diagramming layer at all.
baptiste auguie
package author (who has internalised the framework in the creation
process). I find that, even though each function has a fairly
self-descriptive name, it's quite hard to keep track of what's going
on when I dig into the source code of these packages.
To me it's a bit like looking at individual pieces of a jigsaw puzzle:
I can see that this particular piece fits with this one to form some
shape, but where did I see the one the should go right here? Also,
what is the big picture again? I need that visual map+index.
This is perhaps because each function performs a relatively small task
(a good thing), which means that in order to get from the general task
to the lower level you have to follow a string of intermediate
functions, somewhat delocalised. That track is what the links between
boxes would represent (they're not necessarily arrows with a
direction). In such a diagram I'd like each box (major function) to
have an input, an output, and its description should be a task.
I'll see if something useful emerges after a few iterations (I realise
now that "layer" should rather be enclosing all the rest; some boxes
should be isolated, etc.)
Cheers,
baptiste
baptiste auguie
Should anyone wants to play, I attach a pdf with the pieces currently
present in the layers package.
I attempted a (sloppy) classification of the functions together with
their arguments; quite a few are certainly not in the right place, for
I failed to guess what they do from the name.
b.
On 29 December 2011 13:01, baptiste auguie

Kohske Takahashi
Aside from the details of implementation, as of now I have one
question about general design of geom.
How are the inside and outside aes different?
For example, in geom_path, linetype is defined as aesthetic parameter
while lineend etc. is not.
Is the any general and consistent rules for these separations?
Also, param in data, param in inside aes, and param in outside aes
will make confusion:
> df <- data.frame(x = 1:10, y = 1:10, width = 1:10/10)
> geom_plot(geom_bar(list(colour = "white")), df) # width = 1:10/10
> geom_plot(geom_bar(list(colour = "white"), width = 1), df) # width = 1:10/10
> geom_plot(geom_bar(list(colour = "white", width = 1)), df) # width = 1
It looks like that the priority is:
inside aes > data > outside aes.
Is this the rule?
OK, what I want to ask is that, why we need the outside-aes
parameters, such as width in bar or lineend in path?
--
Kohske Takahashi <takahash...@gmail.com>
Research Center for Advanced Science and Technology,
The University of Tokyo, Japan.
http://www.fennel.rcast.u-tokyo.ac.jp/profilee_ktakahashi.html
2011/12/29 baptiste auguie <baptist...@googlemail.com>:
Hadley Wickham
> present in the layers package.
> I attempted a (sloppy) classification of the functions together with
> their arguments; quite a few are certainly not in the right place, for
> I failed to guess what they do from the name.
I really like this diagram because it makes me think it could be
automated and hence might be something that I could actually keep up
to date. Could you give a few more details about how you created it?
Hadley Wickham
> question about general design of geom.
>
> How are the inside and outside aes different?
>
> For example, in geom_path, linetype is defined as aesthetic parameter
> while lineend etc. is not.
> Is the any general and consistent rules for these separations?
Generally, anything outside aes can't vary with individual elements -
lineend etc are global parameters that affect every line drawn by the
geom. It's also partly personal preference - the fewer things in the
aesthetics and the more things that are constant, the simple the code
is (and hopefully also faster).
> Also, param in data, param in inside aes, and param in outside aes
> will make confusion:
>
>> df <- data.frame(x = 1:10, y = 1:10, width = 1:10/10)
>> geom_plot(geom_bar(list(colour = "white")), df) # width = 1:10/10
>> geom_plot(geom_bar(list(colour = "white"), width = 1), df) # width = 1:10/10
>> geom_plot(geom_bar(list(colour = "white", width = 1)), df) # width = 1
Yes, that is confusing - but I it's because it's a bug. Width is an
aesthetic and so shouldn't be a parameter.
> It looks like that the priority is:
> inside aes > data > outside aes.
> Is this the rule?
The rule is aes > data. There shouldn't be any cases where we have
both inside and outside aes -
> OK, what I want to ask is that, why we need the outside-aes
> parameters, such as width in bar or lineend in path?
These are generally for things that aren't aesthetics, or
can't/shouldn't/don't vary across rows in the data. I'm still
thinking about this so your feedback is really useful - I definitely
want to end up with a simpler design but more flexibly than the
current.
Also, I'm currently thinking that the layers package will be broken up
in the geom, stat and adjust pieces - they don't really have much in
common, and the idea of a layer is really quite ggplot2 specific.
(The other purpose of breaking ggplot2 up into pieces is so other
graphics packages can pick and choose and implement their own
frameworks)
Kohske Takahashi
Another question is how do coord and geom interacts in premunch?
If I correctly understand, coordinate transformation needs to take
place after munch, before or during geom_draw.
In most cases, actual drawing codes would depend on the coordinate system.
Probably this would make separating geom such a difficult task.
How will this be handled?
--
Kohske Takahashi <takahash...@gmail.com>
Research Center for Advanced Science and Technology,
The University of Tokyo, Japan.
http://www.fennel.rcast.u-tokyo.ac.jp/profilee_ktakahashi.html
2011/12/29 Hadley Wickham <had...@rice.edu>:
Hadley Wickham
>
> If I correctly understand, coordinate transformation needs to take
> place after munch, before or during geom_draw.
Correct - but the layers package knows nothing about coordinate
systems or munching so it wouldn't be done in geom_plot, but in
whatever is using the layers package.
> In most cases, actual drawing codes would depend on the coordinate system.
> Probably this would make separating geom such a difficult task.
The idea of geom_premunch is to get the data/geom into a form where
munching is easy - you can assume there is a line connecting each row
(separated by groups), so all munching needs to do is break each line
up into many small pieces and individually transform each location.
In other words, I only know how to munch points, lines and polygons,
so geom_premunch should convert any geom into either geom_point,
geom_line or geom_polygon, by transforming the data appropriately.
Kohske Takahashi
> Generally, anything outside aes can't vary with individual elements -
> lineend etc are global parameters that affect every line drawn by the
> geom. It's also partly personal preference - the fewer things in the
> aesthetics and the more things that are constant, the simple the code
> is (and hopefully also faster).
I see. That sounds reasonable.
I call it "decoration" in my head.
Thanks to you and of ggplot2, I learnt that there are two things in
plot-generation, visualization and decoration.
aes-mapping is visualization, that is, a binding between data and
visually perceived feature. So the aes helps to explorer data.
Decoration is opposite. Decoration never takes care about how data is.
It only takes care about how the plot looks to eye. So, in essence,
decoration is not a part of visualization.
As for me as a scientist, visualization is much more important that
decoration, because I want to quickly and deeply explore the data.
However, I also learnt that decoration is also important.
So, data - visualization - decoration may be analogue to idea (or
concept, mind) - text - font.
Definitely font is important.
These are quite interesting topic for me, because it refers how people
visually understand abstract (numeric) data, but completely off-topic
:-p
Someday I may do experiments and write a paper on this topic in
conjunction with cognitive science study... someday.
Too digress.
>
> The rule is aes > data. There shouldn't be any cases where we have
> both inside and outside aes -
I see. That's a simple rule.
>
>> OK, what I want to ask is that, why we need the outside-aes
>> parameters, such as width in bar or lineend in path?
>
> These are generally for things that aren't aesthetics, or
> can't/shouldn't/don't vary across rows in the data. I'm still
> thinking about this so your feedback is really useful - I definitely
> want to end up with a simpler design but more flexibly than the
> current.
I agree with the concept. As the structure of aes and other parameters
are common in all geoms,
maybe implementation should be more explicit like this:
geom_path <- function(aesthetics = list(), deco = list(arrow = NULL,
lineend = "butt", linejoin = "round", linemitre = 1), na.rm = FALSE)
then it will be more obvious that arrow, lineend, etc are parameter
for decoration.
Hadley Wickham
> plot-generation, visualization and decoration.
> aes-mapping is visualization, that is, a binding between data and
> visually perceived feature. So the aes helps to explorer data.
> Decoration is opposite. Decoration never takes care about how data is.
> It only takes care about how the plot looks to eye. So, in essence,
> decoration is not a part of visualization.
I think that's an overly strict definition of visualisation - I'd say
that decoration is a part of visualisation for two reasons:
(1) Decoration can help improve the perception of a graphic. For
example, grid lines are decoration, but they do improve the perception
of change and make comparisons easier (I'm not sure if this has been
experimentally verified but Cleveland has a paper that mentions it)
(2) Accurate perception of values (or comparison of values) is not the
only purpose of visualisation. It's what you're mainly interested in
for exploratory graphics, but expository/communication graphics are
equally important. Decoration is really important when you are using
a graphic to help people understand a complicated subject.
> These are quite interesting topic for me, because it refers how people
> visually understand abstract (numeric) data, but completely off-topic
> :-p
> Someday I may do experiments and write a paper on this topic in
> conjunction with cognitive science study... someday.
That would be great. I've been trying to learn more about cognitive
science so I can run the experiments myself. Last semester I worked
with an undergraduate to do some experiments on mechnical turk to
attempt to generate an ordering of aesthetics for discrete variables -
i.e. which aesthetics form groups most strongly. I even have a
half-written R package that makes it easier to do experiments on
amazon MTurk. One day I'd like to get to the point where I can start
an experiment running over night, analyse the results in the morning,
and then have an improved version of the experiment running by the
next evening.
> I agree with the concept. As the structure of aes and other parameters
> are common in all geoms,
> maybe implementation should be more explicit like this:
>
> geom_path <- function(aesthetics = list(), deco = list(arrow = NULL,
> lineend = "butt", linejoin = "round", linemitre = 1), na.rm = FALSE)
>
> then it will be more obvious that arrow, lineend, etc are parameter
> for decoration.
Hmmmmmmm, I'm not sure I see a big advantage in doing it this way.
Most geoms will have few additional parameters, and making decoration
a separate list makes it a pain to (e.g.) set lineend = "round"
without setting the other decorations.
Kohske Takahashi
> The idea of geom_premunch is to get the data/geom into a form where
> munching is easy - you can assume there is a line connecting each row
> (separated by groups), so all munching needs to do is break each line
> up into many small pieces and individually transform each location.
>
> In other words, I only know how to munch points, lines and polygons,
> so geom_premunch should convert any geom into either geom_point,
> geom_line or geom_polygon, by transforming the data appropriately.
Then, for example, how does coord_polar work with layers?
like this?
data <- geom_data(geom, data)
munched <- geom_premunch(geom, data)
geom <- munched$geom
data <- munched$data
# grob <- geom_draw(geom, data)
grob <- geom_draw_for_coord_polar(geom, data)
and where the geom_draw_for_coord_polar will be defined?
in geom-XXX or in coord_polar?
Hadley Wickham
<takahash...@gmail.com> wrote:
>>
>> The idea of geom_premunch is to get the data/geom into a form where
>> munching is easy - you can assume there is a line connecting each row
>> (separated by groups), so all munching needs to do is break each line
>> up into many small pieces and individually transform each location.
>>
>> In other words, I only know how to munch points, lines and polygons,
>> so geom_premunch should convert any geom into either geom_point,
>> geom_line or geom_polygon, by transforming the data appropriately.
>
> Then, for example, how does coord_polar work with layers?
> like this?
>
> data <- geom_data(geom, data)
>
> munched <- geom_premunch(geom, data)
> geom <- munched$geom
> data <- munched$data
>
> # grob <- geom_draw(geom, data)
> grob <- geom_draw_for_coord_polar(geom, data)
Like this:
data <- geom_data(geom, data)
premunch <- geom_premunch(geom, data)
geom <- premunch$geom
data <- premunch$data
data <- coord_munch(coord_polar(), data)
grob <- geom_draw(geom, data)
coord_polar() knows nothing about geoms - it just knows how to
transform the data.
Kohske Takahashi
>> Thanks to you and of ggplot2, I learnt that there are two things in
>> plot-generation, visualization and decoration.
>> aes-mapping is visualization, that is, a binding between data and
>> visually perceived feature. So the aes helps to explorer data.
>> Decoration is opposite. Decoration never takes care about how data is.
>> It only takes care about how the plot looks to eye. So, in essence,
>> decoration is not a part of visualization.
>
> I think that's an overly strict definition of visualisation - I'd say
> that decoration is a part of visualisation for two reasons:
Yes, yes. It's too strict and too theoretical. The separation is based
on a kind of cognitive process in human.
>
> (1) Decoration can help improve the perception of a graphic. For
> example, grid lines are decoration, but they do improve the perception
> of change and make comparisons easier (I'm not sure if this has been
> experimentally verified but Cleveland has a paper that mentions it)
>
> (2) Accurate perception of values (or comparison of values) is not the
> only purpose of visualisation. It's what you're mainly interested in
> for exploratory graphics, but expository/communication graphics are
> equally important. Decoration is really important when you are using
> a graphic to help people understand a complicated subject.
Thanks. I know that many journals have their "standard decoration" for
figures in publication.
Aslo, I need decoration to show results to the others in presentations
and publications.
This is a kind of communication/expository. I don't mean that
decoration is less important in all situation.
That's case by case.
>
>> These are quite interesting topic for me, because it refers how people
>> visually understand abstract (numeric) data, but completely off-topic
>> :-p
>> Someday I may do experiments and write a paper on this topic in
>> conjunction with cognitive science study... someday.
>
> That would be great. I've been trying to learn more about cognitive
> science so I can run the experiments myself. Last semester I worked
> with an undergraduate to do some experiments on mechnical turk to
> attempt to generate an ordering of aesthetics for discrete variables -
> i.e. which aesthetics form groups most strongly. I even have a
> half-written R package that makes it easier to do experiments on
> amazon MTurk. One day I'd like to get to the point where I can start
> an experiment running over night, analyse the results in the morning,
> and then have an improved version of the experiment running by the
> next evening.
Excellent!! Just in case, "which aesthetics form groups most strongly"
may be relevant to "perceptual organization."
>
>
>> I agree with the concept. As the structure of aes and other parameters
>> are common in all geoms,
>> maybe implementation should be more explicit like this:
>>
>> geom_path <- function(aesthetics = list(), deco = list(arrow = NULL,
>> lineend = "butt", linejoin = "round", linemitre = 1), na.rm = FALSE)
>>
>> then it will be more obvious that arrow, lineend, etc are parameter
>> for decoration.
>
> Hmmmmmmm, I'm not sure I see a big advantage in doing it this way.
> Most geoms will have few additional parameters, and making decoration
> a separate list makes it a pain to (e.g.) set lineend = "round"
> without setting the other decorations.
I think the advantage is a kind of theoretical consistency. But there
is also disadvantage of writing much.
I'm not sure which is better.
thanks,
kohske
Hadley Wickham
>> science so I can run the experiments myself. Last semester I worked
>> with an undergraduate to do some experiments on mechnical turk to
>> attempt to generate an ordering of aesthetics for discrete variables -
>> i.e. which aesthetics form groups most strongly. I even have a
>> half-written R package that makes it easier to do experiments on
>> amazon MTurk. One day I'd like to get to the point where I can start
>> an experiment running over night, analyse the results in the morning,
>> and then have an improved version of the experiment running by the
>> next evening.
>
> Excellent!! Just in case, "which aesthetics form groups most strongly"
> may be relevant to "perceptual organization."
Yes, exactly. We've been trying for a quantification of the gestalt principles.
>> Hmmmmmmm, I'm not sure I see a big advantage in doing it this way.
>> Most geoms will have few additional parameters, and making decoration
>> a separate list makes it a pain to (e.g.) set lineend = "round"
>> without setting the other decorations.
>
> I think the advantage is a kind of theoretical consistency. But there
> is also disadvantage of writing much.
> I'm not sure which is better.
I'm also not entirely sure that it's obvious what is and isn't a decoration.
baptiste auguie
>> Should anyone wants to play, I attach a pdf with the pieces currently
>> present in the layers package.
>> I attempted a (sloppy) classification of the functions together with
>> their arguments; quite a few are certainly not in the right place, for
>> I failed to guess what they do from the name.
>
> I really like this diagram because it makes me think it could be
> automated and hence might be something that I could actually keep up
> to date. Could you give a few more details about how you created it?
I imagine it could be fully automated with a little more work, and
some additional meta-data for the placement. I attach the script I
wrote to extract the pieces from layers and draw them in individual
pdf files, which I then moved around in Illustrator. I could not find
a way to list non-exported functions of the package other than
sourcing the R files.
Cheers,
baptiste

Winston Chang
> I agree with the concept. As the structure of aes and other parametersHmmmmmmm, I'm not sure I see a big advantage in doing it this way.
> are common in all geoms,
> maybe implementation should be more explicit like this:
>
> geom_path <- function(aesthetics = list(), deco = list(arrow = NULL,
> lineend = "butt", linejoin = "round", linemitre = 1), na.rm = FALSE)
>
> then it will be more obvious that arrow, lineend, etc are parameter
> for decoration.
Most geoms will have few additional parameters, and making decoration
a separate list makes it a pain to (e.g.) set lineend = "round"
without setting the other decorations.