Can I make scale.ticks(n) output fractions of the maximum value?

Chad Burt

Mike Bostock
> with an irregular scale. Any suggestions would be greatly appreciated.
Right, you probably want to increase the size of the domain to the
next highest "round" value. Protovis has a method to do this, but we
haven't ported it to D3 yet:
https://github.com/mbostock/protovis/blob/master/src/data/QuantitativeScale.js#L375
If you know that your domain starts at 0 (a safe assumption for a bar
chart), you can accomplish the same thing by hand:
var x1 = x.domain()[1], dx = Math.pow(10, Math.round(Math.log(x1) /
Math.log(10)) - 1);
x.domain([0, Math.ceil(x1 / dx) * dx]);
Mike
Chad Burt
I tried playing around with this and looking at the code in protovis,
but I'm still having some trouble. I'm using this same code for data
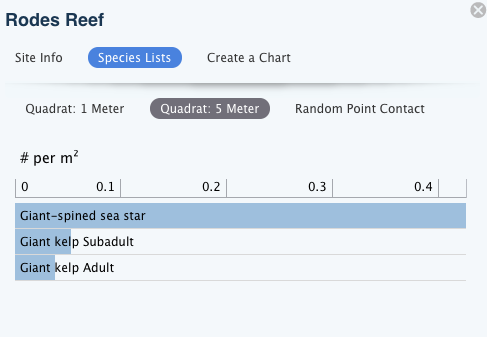
in the range of 0 - 0.4, and having some trouble since the max scale
value then snaps all the way to 1.0. Another problem is where I use it
for percentage values. I have a value of 80% in my dataset, and 4 tics
at 20, 40, 60, and 80. Adding those lines to change the x scale will
make the domain 0 to 90, but the output of ticks() still only outputs
20, 40, 60, and 80.
It's getting a bit messy so I'll need to try and better understand
what your code is doing... but I'm not so hot at math. Do you have any
pointers for understanding what you're intending to accomplish with
Math.log?
--
-Chad

Matthew Smillie
> what your code is doing... but I'm not so hot at math. Do you have any
> pointers for understanding what you're intending to accomplish with
> Math.log?
Because Math.log() is the natural logarithm (base e), there needs to
be a bit of manipulation to get the desired result. The identity
being used to convert the base is described here:
http://mathworld.wolfram.com/NaturalLogarithm.html at equation (4).
The 'why' is a bit more interesting, and worth breaking down. I'll
use an example domain of [0, 65] as an example:
Math.floor(Math.log(x1) / Math.log(10))
- slightly modified from Mike's example, but the same idea. Finds
the order of magnitude of x1, i.e., the next-lowest power of 10. For
our example, this is 1. Mike's using round(), which gives slightly
different boundaries where this will return 1, 2, etc, but the idea is
the same: find a nearby power of 10.
var dx = Math.pow(10, Math.floor(Math.log(x1) / Math.log(10)));
- raises 10 to the power found above. This gives you a "sane"
interval for the domain. E.g., for values 10 <= x < 100, this yields
10. For our example, 10^1 = 10.
Math.ceil(x1 / dx) * dx
Then we round it up to the next whole interval, then multiply by the
interval width to get the new maximum value for the domain.
- The interesting bit. (x1 / dx) gives the number of actual intervals
in the domain. Round that up, and you have the next-highest whole
number of intervals. Then we multiply by the interval width to get
the new maximum value for the domain. In the example: 70.
> I tried playing around with this and looking at the code in protovis,
> but I'm still having some trouble. I'm using this same code for data
> in the range of 0 - 0.4, and having some trouble since the max scale
> value then snaps all the way to 1.0.
next highest multiple of 0.1 (as expected). But you would get it in
Mike's version if you left off the "-1" in the definition of dx. Worth
a double-check.
> Another problem is where I use it
> for percentage values. I have a value of 80% in my dataset, and 4 tics
> at 20, 40, 60, and 80. Adding those lines to change the x scale will
> make the domain 0 to 90, but the output of ticks() still only outputs
> 20, 40, 60, and 80.
minute fraction). Even when you expand the domain, though, there's
still the heuristics used by ticks() to decide on sane values (I
haven't read that code, but it seems to avoid extra significant
digits, and so will probably work better with even multiples of 10.
You might try this sort of thing, though it's quite fragile (assumes
at least 2 ticks, might fall over on boundary conditions I haven't
thought of, etc):
var t = x.ticks(4) // get around 4 ticks from the domain.
var dx = t[1] - t[0] // difference between the ticks.
var x1 = dx * ticks.length; // extend one extra tick value.
x.domain([0, dx * t.length]) // widen the domain
var realTicks = x.ticks(t.length) // request one extra tick than
previously.
regards,
m.
Chad Burt
and I'm starting to get a handle on it. I was getting a little
intimidated by the lack of documentation, but this group has been very
helpful.
I'll try some variations on my data tomorrow morning and post how it goes.
-Chad
--
-Chad
Mike Bostock
There's a ton more documentation here, which I haven't yet linked from the site:
https://github.com/mbostock/d3/wiki/API-Reference
Mike
