Show another view on plot symbol selection
39 views
Skip to first unread message

Amit Chauhan
May 24, 2013, 9:44:23 PM5/24/13
to coreplot...@googlegroups.com
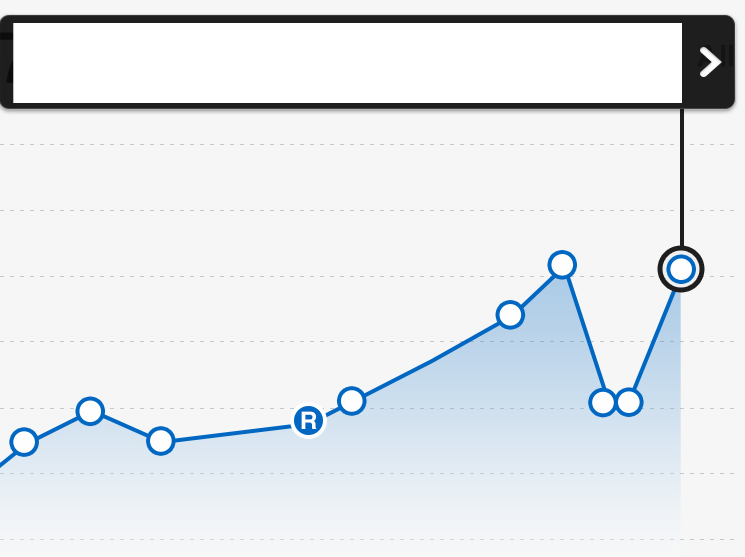
I have 2 requirements when the user taps one of the data points on the graph:
1.
Show a "callout" view on top of the screen, basically, a new UIView on
top of the screen connected to the data point via a line. Hide any
existing//old callout if that was displayed.
2. Change the plotSymbol for the data symbol that was tapped.
How can I do that? Check the attached image as an example what am trying to accomplish.
Thanks
Amit

Eric
May 25, 2013, 6:09:37 PM5/25/13
to coreplot...@googlegroups.com
1. You can use a second scatter plot to draw the circle (with a plot symbol) and the connecting line. See the "Point Selection Demo" in the Mac CPTTestApp for ideas. You'll have to position the custom UIView yourself. Scatter plots have a method called -plotAreaPointOfVisiblePointAtIndex: that will give you the coordinates of the center of a data point in the coordinate space of the plot area layer. Convert that point to the graph's coordinate system using standard CALayer methods. The graph's coordinate system lines up with the coordinate system of the hosting view.
2. Implement the -symbolForScatterPlot:recordIndex: method in your datasource. Set it up to return the "selected" symbol for the selected index. If this method returns nil, the plot will use the default plot symbol (the plotSymbol property) for that point. If it returns [NSNull null], no symbol is shown at that index. Call -reloadDataInIndexRange: on the plot to update the selected symbol and remove the special symbol from a previously selected point.
Eric
Amit Chauhan
May 28, 2013, 1:14:40 PM5/28/13
to coreplot...@googlegroups.com
Thanks Eric. Let me give that a try.
- Amit
- Amit
Amit Chauhan
May 30, 2013, 8:32:46 PM5/30/13
to coreplot...@googlegroups.com
Eric,
That worked great. The example you cited was really helpful.
Thanks
Amit
That worked great. The example you cited was really helpful.
Thanks
Amit
Reply all
Reply to author
Forward
0 new messages