PM - Particulate sensor

NeilH
Hi
I wonder is anybody interested in kicking around a Particulate Monitor design in detail?
Seems like there are some knowledgeable users interested in a open design particulate monitor.
The design looks to me like it requires a combination of talents from the final air quality metric, to electronic to mechanical issues.
From Tim Dye of Sonoma Technology Table
|
Pollutant |
Health Concern1 |
Atmospheric Concentration Range2 |
Health Standard3 |
Accuracy7 |
Time Resolution |
Location |
|
|||||
|
Urban |
Rural |
Near Trans. |
Worldwide |
Outdoor |
Indoor |
Season |
||||||
|
Particles |
||||||||||||
|
PM2.5 |
R, H, V |
~0-300 mg/m3 |
35 mg/m3 24-hr |
1-5 mg/m3 |
1 min to 1-hr |
ü |
ü |
ü |
ü |
ü |
ü |
Year-round |
|
PM10 |
R, H, V |
~0-500 mg/m3 |
150 mg/m3 24-hr |
~10 mg/m3 |
1 min to 1-hr |
ü |
ü |
ü |
|
ü |
|
Year-round |
|
Black Carbon |
H, V |
~0-50 mg/m3 |
None6 |
1-5 mg/m3 |
1 min to 1-hr |
ü |
|
ü |
ü |
ü |
ü |
Year-round |
|
|
||||||||||||
Looking at the Sharp GP2Y1010AU0F Dust Sensor.
It specifies a minimum Sensitivy of 0.35 V/(0.1mg/m3) and an output voltage range of 3.4V The measuring algorithm is to pulse 100 times a second for 320uSeconds and sample output 280uS after turning on Led.
The GP2Y1010AU0F units seem a bit strange as clearly it doesn’t have a m3 inside its package.
ON its Internal Schematic is says “Dust through hole”.
So as a digital snapshot it can provide a response to any particles that are there – but the IR reflection is likely to be dependent on many factors and might only be found by experimenting.
And then a m3 of air has to be moved past the hole.
However no specification for the depth of the field that dust can be detected – is it 1mm or 10mm (guess at 4mm see later)
For the electronics the real challenge is the lower end of PM2.5 scale 35 mg/m3 24-hr with an accuracy 1-5 mg/m3
So this 24 hour measurement needs to be distributed over the total number of samples to be taken.
The key it would seems is the accuracy of 1-5 mg/m3
What would GP2Y1010AU0F output look like if it was detecting a particle of 1-5 mg
Well its specified for 350mV/(0.1mg/m3) so maybe this can be 3.5mV/1.0 mg/m3
Which at least on paper looks doable
If a 12bit ADC is used with a 4V range – then it can sample at 1mV. So that looks doable.
Now moving a m3 in say useable time, say 1hr over the front of the hole is a mechanical challenge and possibly some more math.
The hole is 8mm in diameter – but probably not all useable. If it is approximated to 4x4mm with a depth of 4mm – then this is a volume of 64 mm3
So at a sample rate of a 360,000/hr this is 0.023 m3 which is a significantly less than the target of 1 m3 (any holes in my maths).
So this might require some rationalizing on getting to the air flow of 1 m3 / hour.
So the next challenge would be how to differentiate between the three types of particulates – BlackCarbon, PM10 PM2.5
Presumably BlackCarbon is the larger particle – so the process may be about trying to filter out the three particle sizes and do it with a mass of air flowing over it, and then make three separate measurements.
Any ideas?
The other design areas that are a challenge are the
* Moving air over the sensor – can probably be done with a low cost fan, but needs careful design to avoid particulate being blown into the sensor (see data sheet). Seems doable in a detail design.
* Environmental considerations – should survive temperature extremes outdoors from Lima to Patagonia, Jakarta to Bejing, Arizona/Florida to the Canadian North. * Should survive humidity fluctuations. ? Humidity not specified on data sheet. This is a red flag. May not work in humidity, or the very least design should be so condensing moisture drains away. “When inside of the sensor is moisturized, this product does not keep its proper function. Please design the application so that moisturization of the sensor does not happen.”
Any comments/ideas/brain waves
If I'm completely on the wrong track, appreciate the feedback/insights.

Gustavo Olivares
Great idea ... I've been working on air quality research for the past 10 years and instrument design is always fun!!
Now, to your post, not quite on the wrong track but I'd like to clarify a few points (please don't take them in the wrong way, I'm just trying to help where I can)
- The table ...
- Location: without more detail I'd argue that all particle related metrics are found everywhere but if the "ticks" refer to "are normally a concern" then I could agree with it. The risk is getting the idea that PMx are different things while they are merely different ways of characterising the aerosol population ... lately people have been working on counting the particles instead of weighting them.
- Accuracy: This is very method dependent and the ranges listed there are OK but optic methods are (theoretically) capable of reaching sub-microgram accuracies and with the levels the way they are in the developed world, that's the accuracy needed to discriminate from the background. A different story is for developing countries.
- The Sharp sensor
- This sensor uses the same technology that the SidePak or DustTrak (both from TSI) use and it can be summarised like this:
- An aerosol population in a volume of air (whatever that is) will absorb, reflect and scatter light (that's why we see the clouds and why on dusty evenings the horizon looks brownish). The amount of light absorbed is very dependent on the chemical composition of the surface, the reflected part depends on a mixture of shape and surface type (colour). The scattering of light can be described in relation to the size of individual particles or the mass of a group of particles (See here for a lecture on scattering).
- Controlling the wavelength of the light used, one can "tune" the response of the instrument to larger or smaller particles.
- The scattered light will then be directly correlated to the particle mass in the "sensing volume"
- Since you know the volume that the light is shone on ... you can calculate the concentration (even if you don't have 1m3 in there)
- The main difference is that the TSI units have a pump but that is not a requirement of the sensing method but rather a requirement for the sizing inlet that is required to cut off particles larger than what you're measuring. Also, that flow cannot be too high because if you have too few particles in the sensing volume, then the assumptions of "uniformly distributed aerosol in the sensing volume" start to shake
- So, it is not necessary to get 1m3/hr for those units to work. I've used the Sharp units (with no forced flow through it) against the TSI ones and I got 98% correlation for "cooking sources" (I think it was frying oil) and others have also shown that that unit can also correlate strongly with other combustion-related aerosols (smoking, vehicle emissions, etc)
- Black Carbon. Again, this is part of the particles but it is the part that is very closely related to very fresh combustion emissions. In terms of sizes, black carbon usually has a peak size around 100nanometers (0.1 microns) so you'll always get black carbon in your PMx sample. Now, and here the plot thickens ... there is no agreement on what "black carbon" is because it depends on how you measure it. Some people call black carbon to an optical measure, others refer as black carbon to what is obtained using thermal methods (literally cooking filters) and on top of that people talk about elemental carbon as a synonym of black carbon. I'm on the "optical" camp and I call it "black" because the optical methods measure the "blackness" of the particles. Now, this may be simpler to measure. There are many units out there of different costs but they are based on more or less the same principle.
- PSAP (Particle Soot Aerosol Photometer). Developed by NOAA it can be implemented reasonably easily (I did my own last year based on an arduino, a light source and a couple of light-to-frequency sensors) but it is somewhat labour intensive in that the filter needs moving/changing often (see here for the design details from NOAA)
- Sizing. The aerosol spectrometers (a.k.a. optical particle counters) work by shining a laser to single particles and then characterising the scattering "pulse". By using the appropriate wavelength laser one can relate the scattering of the single particles into the size of that particle from ~0.15 to 30 microns. They are expensive but the fundamental design is not complex, the difficulties are having a fast enough circuit to catch the scattering pulse, align the laser to the path of the particles and ensure that the particles are going one-by-one into the measurement chamber.
OK ... now to the bullet points you mention ... my thoughts are:
- Moving air. If an optical method is used, then this is not necessary. I've tried the Sharp with and without a fan and the result was the same so to save power and simplify the design, I'd say no fan unless you're certain that the air will "never" pass through the sensing volume unless you push/pull it.
- Env conditions (including humidity). The particles change with different temperature and humidity but more importantly, the Sharp unit as a "baseline" dependence with temperature. This is another thing I found in my tests, the "zero" of the unit changes with temperature but that is not really a problem as long as you have temperature measurement near the sensor. The "condensation" issue is more complicated but that would be an issue if the sensor is at a significantly lower temperature than the air it is sensing so I'd say that by keeping the sensor at a temperature similar (ideally a little higher) to the outside, it should be OK.
OK, this is already too long so I'll leave it to here but I'd like to stress that it would be really good to have a dust sensor design that fits the low-cost end and enable more community engagement.
/El Gus

Ed Borden

Chris Nafis
Ed Borden
Gustavo Olivares
That matches perfectly with the tests I've been performing (there is a PDF somewhere in the forum with a plot of it)
/El Gus
On Wednesday, 18 April 2012 15:39:39 UTC+12, Nafis wrote:
Chris Nafis
bruno aubert
I really appreciate your project and my only aims is you meet success.
As I wrote in my previous post, it is very important the measurement targets minimum requirements. If uncertainty of the measurement is higher 50% I'm strongly thinking it could be impossible to manage network sensors in large area especially far from regulatory measurement stations.
It is for this reason we have European law concerning detection device (requirement of uncertainty of 30% for some gases and 50% for PM): DIRECTIVE 2008/50/EC OF THE EUROPEAN PARLIAMENT AND OF THE COUNCIL of 21 May 2008 on ambient air quality and cleaner air for Europe
If you meet these requirements regulatory agencies could help you.
I'm confident it is possible to have accurate measurement even with low cost devices but it is absolutely necessary to have:
* dynamic air sampling like micro fan (by mass it is cheap)
* stable sensor� (for one year or more) like electrochemical sensor
* high sensitive electronic circuitry: I don't know Arduino systems, I'm using MSP 430 (very cheap)
* PM 2.5 separation...you're right, the most dangerous pollution is concerning PM and especially PM2.5
My company is developing small devices at efficient cost since 6 years. Our core business is concerning diffuse emission of low concentration (ppb range) pollutants around WWTP or waste facilities (H2S, CH4S, NH3, CH2O, COVTNM...)
Please find attached some results obtained with our O3/NO2 sensors (these 2 gases are very irritant for asthmatics) in comparison with reference devices in big town (south of France).
We can reach the same accuracy for PM2.5 (be careful by comparing data of Sharp device with another optical system like nephelometry: on internet it exist a lot of comparisons between references devices and nephelometers: it exists differences up to 10 times!).
Kind regards,
Bruno Aubert
CEO
Cairpol
Le 18/04/2012 05:50, Ed Borden a �crit�:
Chris, this is fantastic. �I have to tell you that from all of the conversations I've had with people all over the place up until about a week ago I was convinced that PM was out of the range of possibility for "us". The fact is that if we'd known this when we started this project, we'd have included the Sharp sensor in the standard kit from the beginning. �We just didn't know.
Between yourself and Gus, I think you have really opened the door for accessing what I've understood to be the most important "air quality" metric. �It's really a huge step, and I think a huge part of a project like Air Quality Egg is to be able to provide a platform for people like yourselves to disseminate the work you've done.
HUGE. �Beers are on me fellas.
�
Urban
Rural
Near Trans.
Worldwide
Outdoor
Indoor
Season
Particles
PM2.5
R, H, V
~0-300 mg/m3
35 mg/m3 24-hr
1-5 mg/m3
1 min to 1-hr
�
�
�
�
�
�
Year-round
PM10
R, H, V
~0-500 mg/m3
150 mg/m3�24-hr
~10 mg/m3
1 min to 1-hr
�
�
�
�
�
�
Year-round
Black Carbon
H, V
~0-50 mg/m3
None6
1-5 mg/m3
1 min to 1-hr
�
�
�
�
�
�
Year-round
�
There is also a PM1.0 (a fourth range)�
Looking at the Sharp GP2Y1010AU0F Dust Sensor.
It specifies a minimum Sensitivy of 0.35 V/(0.1mg/m3) and an output voltage range of 3.4V The measuring algorithm is to pulse 100 times a second for 320uSeconds and sample output 280uS after turning on Led.
The GP2Y1010AU0F units seem a bit strange as clearly it doesn�t have a m3 inside its package.
ON its Internal Schematic is says �Dust through hole�.
So as a digital snapshot it can provide a response to any particles that are there � but the IR reflection is likely to be dependent on many factors and might only be found by experimenting.
And then a m3 of air has to be moved past the hole.
However no specification for the depth of the field that dust can be detected � is it 1mm or 10mm (guess at 4mm see later)�
For the electronics the real challenge is the lower end of PM2.5 scale 35 mg/m3 24-hr with an accuracy 1-5 mg/m3
So this 24 hour measurement needs to be distributed over the total number of samples to be taken.
The key it would seems is the accuracy of 1-5 mg/m3
What would GP2Y1010AU0F output look like if it was detecting a particle of 1-5 mg
Well its specified for 350mV/(0.1mg/m3) so maybe this can be 3.5mV/1.0 mg/m3
Which at least on paper looks doable
If a 12bit ADC is used with a 4V range � then it can sample at 1mV. So that looks doable.
Now moving a m3 in say useable time, say 1hr over the front of the hole is a mechanical challenge and possibly some more math.
The hole is 8mm in diameter � but probably not all useable. If it is approximated to 4x4mm with a depth of 4mm � then this is a volume of 64 mm3
So at a sample rate of a 360,000/hr this is �0.023 m3 which is a significantly less than the target of 1 m3 (any holes in my maths).
So this might require some rationalizing on getting to the air flow of 1 m3 / hour.
So the next challenge would be how to differentiate between the three types of particulates � BlackCarbon, PM10 PM2.5
Presumably BlackCarbon is the larger particle � so the process may be about trying to filter out the three particle sizes and do it with a mass of air flowing over it, and then make three separate measurements.
Any ideas?
The other design areas that are a challenge are the
* Moving air over the sensor � can probably be done with a low cost fan, but needs careful design to avoid particulate being blown into the sensor (see data sheet). Seems doable in a detail design.
* Environmental considerations � should survive temperature extremes outdoors from Lima to Patagonia, Jakarta to Bejing, Arizona/Florida to the Canadian North. * Should survive humidity fluctuations. ? Humidity not specified on data sheet. This is a red flag. May not work in humidity, or the very least design should be so condensing moisture drains away. �When inside of the sensor is moisturized, this product does not keep its proper function. Please design the application so that moisturization of the sensor does not happen.��
Any comments/ideas/brain waves
If I'm completely on the wrong track,�appreciate�the feedback/insights.

Philip Orton
If useful, I could get info on a pump model we used in my PhD work to
sample CO2. The air flows were on the order of 1 liter per minute I
think, and the general type of pump is a fish tank pump.
Send me an email separately if this would be useful.
Philip Orton
On Apr 17, 2:09 pm, NeilH <neil...@wllw.net> wrote:
> Hi
>
> I wonder is anybody interested in kicking around a Particulate Monitor
> design in detail?
> Seems like there are some knowledgeable users interested in a open design
> particulate monitor.
> The design looks to me like it requires a combination of talents from the
> final air quality metric, to electronic to mechanical issues.
>
> From Tim Dye of Sonoma Technology Table
>
>
> *Health Concern1*
>
> *Atmospheric*
>
> *Concentration Range2*
>
> *Health Standard3*
>
> *Accuracy7*
>
> *Time Resolution*
>
> *Location*
>
> * *
> Urban
>
> Rural
>
> Near Trans.
>
> Worldwide
>
> Outdoor
>
> Indoor
>
>
> *Particles*
> *
Gustavo Olivares
so we can progress that design forward.
http://airqualityegg.wikispaces.com/
Who do we bribe to get write access? :-)
/El Gus
Ed Borden

Joseph Saavedra
Chris Nafis
----- Original Message -----From: Joseph SaavedraSent: Wednesday, April 18, 2012 6:51 PMSubject: Re: PM - Particulate sensor
bruno aubert
1 liter/mn could be OK even for the Sharp.
I'm testing since 2 years the Sharp with micro fan and PM2.5 classification and the results are impressive: the sensitivity reaches few �g/m3 and it is good correlation with TEOM-FDMS (in city center area).
I have to insist about comparison: please check thereafter results obtained by French agency with several optical devices Vs TEOM-FDMS: except for the Grimm (expansive cost) it occurs large differences (up to 5 times).
Sorry for the French sentences, it means: incense tests with several optical indicators Vs TEOM and TEOM-FDMS
Regards
Bruno

Le 18/04/2012 23:13, Philip Orton a �crit�:
Great stuff!

If useful, I could get info on a pump model we used in my PhD work to
sample CO2.  The air flows were on the order of 1 liter per minute I
think, and the general type of pump is a fish tank pump.

Send me an email separately if this would be useful.
Philip Orton


On Apr 17, 2:09�pm, NeilH <neil...@wllw.net> wrote:
Hi I wonder is anybody interested in kicking around a Particulate Monitor design in detail? Seems like there are some knowledgeable users interested in a open design particulate monitor. The design looks to me like it requires a combination of talents from the final air quality metric, to electronic to mechanical issues. From Tim Dye of Sonoma Technology Table *Pollutant* *Health Concern1* *Atmospheric* *Concentration Range2* *Health Standard3* *Accuracy7* *Time Resolution* *Location* * * Urban Rural Near Trans. Worldwide Outdoor Indoor *Season* *Particles* PM2.5 R, H, V ~0-300 mg/m3 35 mg/m3 24-hr 1-5 mg/m3 1 min to 1-hr � � � � � � Year-round PM10 R, H, V ~0-500 mg/m3 150 mg/m3 24-hr ~10 mg/m3 1 min to 1-hr � � � � Year-round Black Carbon H, V ~0-50 mg/m3 None6 1-5 mg/m3 1 min to 1-hr � � � � � Year-round * * There is also a PM1.0 (a fourth range) Looking at the Sharp GP2Y1010AU0F Dust Sensor. It specifies a minimum Sensitivy of 0.35 V/(0.1mg/m3) and an output voltage range of 3.4V The measuring algorithm is to pulse 100 times a second for 320uSeconds and sample output 280uS after turning on Led. The GP2Y1010AU0F units seem a bit strange as clearly it doesn�t have a m3 inside its package. ON its Internal Schematic is says �Dust through hole�. So as a digital snapshot it can provide a response to any particles that are there � but the IR reflection is likely to be dependent on many factors and might only be found by experimenting. And then a m3 of air has to be moved past the hole. However no specification for the depth of the field that dust can be detected � is it 1mm or 10mm (guess at 4mm see later) For the electronics the real challenge is the lower end of PM2.5 scale 35 mg/m3 24-hr with an accuracy 1-5 mg/m3 So this 24 hour measurement needs to be distributed over the total number of samples to be taken. The key it would seems is the accuracy of 1-5 mg/m3 What would GP2Y1010AU0F output look like if it was detecting a particle of 1-5 mg Well its specified for 350mV/(0.1mg/m3) so maybe this can be 3.5mV/1.0 mg/m3 Which at least on paper looks doable If a 12bit ADC is used with a 4V range � then it can sample at 1mV. So that looks doable. Now moving a m3 in say useable time, say 1hr over the front of the hole is a mechanical challenge and possibly some more math. The hole is 8mm in diameter � but probably not all useable. If it is approximated to 4x4mm with a depth of 4mm � then this is a volume of 64 mm3 So at a sample rate of a 360,000/hr this is �0.023 m3 which is a significantly less than the target of 1 m3 (any holes in my maths). So this might require some rationalizing on getting to the air flow of 1 m3 / hour. So the next challenge would be how to differentiate between the three types of particulates � BlackCarbon, PM10 PM2.5 Presumably BlackCarbon is the larger particle � so the process may be about trying to filter out the three particle sizes and do it with a mass of air flowing over it, and then make three separate measurements. Any ideas? The other design areas that are a challenge are the * Moving air over the sensor � can probably be done with a low cost fan, but needs careful design to avoid particulate being blown into the sensor (see data sheet). Seems doable in a detail design. * Environmental considerations � should survive temperature extremes outdoors from Lima to Patagonia, Jakarta to Bejing, Arizona/Florida to the Canadian North. * Should survive humidity fluctuations. ? Humidity not specified on data sheet. This is a red flag. May not work in humidity, or the very least design should be so condensing moisture drains away. �When inside of the sensor is moisturized, this product does not keep its proper function. Please design the application so that moisturization of the sensor does not happen.� Any comments/ideas/brain waves If I'm completely on the wrong track, appreciate the feedback/insights.
Nafis
Great graph. From my quick tests it is clear that the sharp sensor
correlates well for high particle count environments. For indoor
applications it mostly sees noise unless someone is cooking (compared
to Dylos monitor). From your tests, do you have a better idea of where
the Sharp sensor "kicks in". In other words, at what particle count it
starts to register? Is there a good way to produce 2.5micron particles
in an increasing linear fashion in a controlled way for testing?
On Apr 19, 3:11 am, bruno aubert <bruno.aub...@cairpol.com> wrote:
> Hi
>
> 1 liter/mn could be OK even for the Sharp.
> I'm testing since 2 years the Sharp with micro fan and PM2.5
> classification and the results are impressive: the sensitivity reaches
> few �g/m3 and it is good correlation with TEOM-FDMS (in city center area).
> I have to insist about comparison: please check thereafter results
> obtained by French agency with several optical devices Vs TEOM-FDMS:
> except for the Grimm (expansive cost) it occurs large differences (up to
> 5 times).
> Sorry for the French sentences, it means: incense tests with several
> optical indicators Vs TEOM and TEOM-FDMS
>
> Regards
> Bruno
>
>
>
>
>
>
>
> > Great stuff!
>
> > If useful, I could get info on a pump model we used in my PhD work to
> > sample CO2. The air flows were on the order of 1 liter per minute I
> > think, and the general type of pump is a fish tank pump.
>
> > Send me an email separately if this would be useful.
> > Philip Orton
>
Nafis
You can get historical data from Pachube using HTML requests (See the
API document https://pachube.com/docs/v2/history.html )
For example to get data from my Sharp sensor yesterday every 2 minutes
you would do:
http://api.pachube.com/v2/feeds/55892/datastreams/2.csv?start=2012-04-18T18:00:00Z&end=2012-04-19T14:00:07Z&interval=120&per_page=1000
You need to know the feed number (55892), the stream number (2 =
guestimate of particles per 0.01 cubic feet), start/end times, the
interval (120 seconds), and you have to be careful that you aren't
returning more than 1000 datapoints (the maximum)
The corresponding data from the Dylos monitor would be:
http://api.pachube.com/v2/feeds/55522/datastreams/1.csv?start=2012-04-18T18:00:00Z&end=2012-04-19T14:00:07Z&interval=120&per_page=1000
where stream 1 is 2.5> micron particles
> 109KViewDownload
NeilH
Thanks for the references to the data stream and API interface.
2012-04-18T22:29:57.301603Z,     339
2012-04-18T22:39:56.117367Z,     171
2012-04-18T22:44:51.657774Z,     229
2012-04-18T22:49:54.203825Z,    1082
2012-04-18T22:54:59.859396Z,    1519
2012-04-18T22:59:55.334612Z,    1525
2012-04-18T23:04:50.884449Z,    1435
2012-04-18T23:09:56.354095Z,     469
2012-04-18T23:14:51.871184Z,    1112
2012-04-18T23:19:57.468833Z,     924
Nafis
an integer from 0-1023. This gives a resolution between readings of 5
volts/1024 units or 0.0049 volts per unit. So I multiplied the integer
A/D value by 0.0049 before posting it to Pachube stream 0.
Stream 1 uses the graph from the Sharp Dataset to calculate the dust
density in mg/m^3. I included a graph/equation in my web page: Y =
0.172X-0.1 (I clipped the range to make it a linear function)
Stream 2 multiplies the raw voltage by the formula (V-0.0356)*120000
listed in my web page... although I have been playing with offset
I might move the sensors out to my garage this weekend and do some
"Car tests"... ie run my honda accord or my kubota diesel tractor with
the door shut to see what the particle sensors pick up.
On Apr 19, 11:06 am, NeilH <neil...@sonic.net> wrote:
> Hello Nafis
>
> Thanks for the references to the data stream and API interface.
> I wonder if you could publish (or reference) the complete data path - from
> the circuit interface and algorithm that you are using.
> If you have data processing on the raw data - which is very typical - can
> you capture some of the
> the raw data that is coming from the ADC and the data output that you are
> sending to Pachube.
> There is some movement in the data, but how does it correlate between what
> the sensor provides.
> For example, in small processors the type of math you do, and what size
> variables makes a big difference.
>
> As I said in a previous post - for better or for worse - this where real
> sensor work is done, at the very sensitive end of a physical sensor and
> from my experience it needs a thorough data path analysis, and iterative
> investigation to get a complete system design.
>
> So from your Sharp sensor I wonder what the input is and how it correlates
Philip Orton
that. But I don't think it was less than that.
Also worth mentioning - the trick in using such a cheap pump was to
have it inside a ~3" PVC pipe enclosure, which serves as a pressure
buffer, smoothing out the flow rate. Holes were drilled and plastic
air flow bulkhead connectors and such were utilized with tubing.
Philip
bruno aubert
> Great graph. From my quick tests it is clear that the sharp sensor
> correlates well for high particle count environments. For indoor
> applications it mostly sees noise unless someone is cooking (compared
> to Dylos monitor). From your tests, do you have a better idea of where
> the Sharp sensor "kicks in". In other words, at what particle count it
> starts to register? Is there a good way to produce 2.5micron particles
> in an increasing linear fashion in a controlled way for testing?
I don't agree Sharp sees noise.
This cheap sensor is able to measure low concentration down to about 3
to 5 �g/m3 and ultra fine particulates down to 0.2 �m.
The only thing you have to do is to add PM2.5 separation system with
dynamic air sampling and high sensitive electronic circuitry.
Did you use dynamic air sampling?
To date I can confirm Sharp is able to measure PM2.5 with 50% acuracy
versus TEOM-TDMS in range from 5 to 500 �g/m3 .
regards
Bruno
Nafis
good description somewhere?
Nafis
taken... using better electronics will help.
The low-cost Shinyei Dust sensor I ordered just arrived (http://
www.sca-shinyei.com/pdf/PPD42NS.pdf). This interface uses pulse width
to convey the data. So it might not have the same A/D issues as the
Sharp sensor (probably different ones :-)
NeilH
Cheers
NeilH
> 2012-04-18T22:39:56.117367Z, 171
> 2012-04-18T22:44:51.657774Z, 229
> 2012-04-18T22:49:54.203825Z, 1082
> 2012-04-18T22:54:59.859396Z, 1519
NeilH
Promise to stop posting now - have to do some real work.
Cheers
Gustavo Olivares
http://airqualityegg.wikispaces.com/Dust+Sensor+design
Nafis
grove-dust-sensor-p-1050.html) hooked up to the Arduino last night
and got it posting to Pachube (https://pachube.com/feeds/56469)
The interface is digital and pretty simple (you calculate the ratio of
how long the I/O pulses are low compared to high over 30 seconds). I
took advantage of the Arduino PulseIn() command. I cooked up some
bacon around midnight to see how the three sensors compared (Dylos,
Sharp, and Shinyei). The Dylos "control" data is at https://pachube.com/feeds/55522
.The Shinyei looks much more promising for cheap processors like the
Arduino. I didn't have to deal with the quality of the A/D converter
or additional circuitry. Time will tell, but it looks like I have more
correlation at lower particle concentrations.
I want to add logging of the raw ratios to Pachube since I think I can
create a better transfer function than from the graph in the spec
sheet (http://www.seeedstudio.com/wiki/images/4/4c/Grove_-
_Dust_sensor.pdf).
I didn't use a micro fan with this unit. I'm not sure where the air
flow is.
I like the idea of using hepa filters. If I can find ones of different
resolutions, we could make multi-channel systems
I'll try to get things documented this weekend... too many fun/
interesting things and not enough time!
On Apr 19, 3:59 pm, Nafis <na...@nycap.rr.com> wrote:
> Also the Arduino A/D converter is only 10bits. So your point is well
> taken... using better electronics will help.
NeilH
That is if there is 10liter volume - say in a round clear plastic pipe, with an air circulation system (fan) in it - can clean air be introduced through a HEPA filter, and once a lower end '0' be determined, can a known amount of calibration dust be added to determine a 2nd point.
NeilH
Chris Nafis
----- Original Message -----From: NeilHSent: Friday, April 20, 2012 2:54 PMSubject: Re: PM - Particulate sensor
Nafis
I just got the TP1080WC. Pretty nice for the price! Now I just need to
decode the USB interface so I can interface it to the Arduino.
Do you know if anyone has done this? I found the Cumulus software
which lets a Windows PC to upload data to Weather Underground, but I
don't want to tie up a PC. I really want to post the data to Pachube
along with the air quality data.
Chris
On Apr 20, 2:54 pm, NeilH <neil...@sonic.net> wrote:
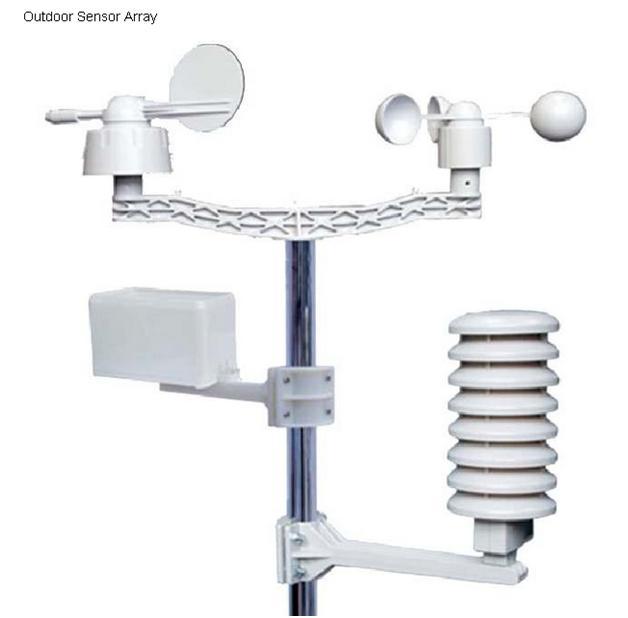
> FYI for any weather sensor junkies I saw this ProWeather Station on sale
> functionality for price is excellent.
>
> Inside the radiation shield is an equipment compartmenthttp://tycononline.com/tp1080wc-4.html
> These pictures, with associated readings, are being used by local policy
> makers to inform decisions on local land use decisions - open space for
> rain water gardens and investigating potential ground water recharge.
>
> 31KViewDownload
Nafis
shield. Unfortunately, the Grove dust sensor (which I think is MUCH
better) does not :-(
> functionality for price is excellent.
>
> Inside the radiation shield is an equipment compartmenthttp://tycononline.com/tp1080wc-4.html
> These pictures, with associated readings, are being used by local policy
> makers to inform decisions on local land use decisions - open space for
> rain water gardens and investigating potential ground water recharge.
>
> 31KViewDownload
NeilH
Nafis
.
It supports sending data to the normal weather sites (eg Weather
Underground, CWOP), but not Pachube.
We need to get Ed Borden to "Evangelize" them :-)
On May 1, 1:40 am, NeilH <neil...@sonic.net> wrote:
> Hello Chris
> sorry no - have thought about it, but not done anything.
> The first stage is what commands are sent down - either find a
> specification - or need to have a snooper on a PC to do that and see howthe
> Cumulus sw slurps in data.
> I think there are some people doing something with posting the data to the
> WeatherUnderground - which means they have decoded the interface to the
> TP1080W
>
> Cheers
> Neil
>
>
>
>
>
>
>
> On Monday, April 30, 2012 8:39:54 PM UTC-7, Nafis wrote:
>
> > Neil,
>
> > I just got the TP1080WC. Pretty nice for the price! Now I just need to
> > decode the USB interface so I can interface it to the Arduino.
> > Do you know if anyone has done this? I found the Cumulus software
> > which lets a Windows PC to upload data to Weather Underground, but I
> > don't want to tie up a PC. I really want to post the data to Pachube
> > along with the air quality data.
>
> > Chris
>
> > On Apr 20, 2:54 pm, NeilH <neil...@sonic.net> wrote:
> > > FYI for any weather sensor junkies I saw this ProWeather Station on sale
> > > for $120
NeilH

Cesar Garcia
Neil--
Cesar García - @elsatch
Ando con encolamiento para responder correos y los proceso lunes, miércoles y viernes. Si es algo urgente/rápido contáctame por Twitter. Gracias!
NeilH
Hi All
I’m at a Water Quality Monitoring Conference in Oregon – and there is a lot of discussion on Sensors and using RealTime communications for monitoring.
Yesterday we heard from the National Ecological Observatory Network www.NeonInc.org … setting up a continental scale ecological internet for scientists. A big issue was quality control for the automated data collection. They went through a whole lot of the process from calibration of sensors, to multipile stages for quality control on the data collected, and then finally stress testing sensors for a range of real world conditions.
Then there was the Alliance for Coast Technologies - http://www.act-us.info/evaluations.php - and they were going through how they provide a forum for emerging sensor technologies (validating the measuring technologies) and comparing the results.
One session was a quick introduction to optical sensors using different wavelengths of lights, what substances absorb light – how to calibrate your sensor and check it periodically.
Newfoundland Canada introduced their river monitoring network – how to calibrate the sensors, how they set up a network to respond to threshold exceedance events and having the mining companies take water samples on exceedance events – and ultimately how to manage the false positives that occurred pretty regularly.
Noboby talking about self calibrating networks of sensors – and this is the group that could really benefit from it, and has a lot of brain power – maybe there is an opening for a computer scientist to present on the subject.

kousalya govardhanan
Any one of you help me to get a pollen monitoring sensor and also what are all the sensors used for air quality monitoring
kousalya govardhanan
> Hi
>
>
> I wonder is anybody interested in kicking around a Particulate Monitor design in detail?
> Seems like there are some knowledgeable users interested in a open design particulate monitor.
> The design looks to me like it requires a combination of talents from the final air quality metric, to electronic to mechanical issues.
>
> From Tim Dye of Sonoma Technology Table
>
>
>
>
>
>
>
>
>
> Health Concern1
>
>
>
> Atmospheric
>
> Concentration Range2
>
>
>
> Health Standard3
>
>
>
> Accuracy7
>
>
>
> Time Resolution
>
>
>
> Location
>
>
>
>
>
>
>
>
> Urban
>
>
>
> Rural
>
>
>
> Near Trans.
>
>
>
> Worldwide
>
>
>
> Outdoor
>
>
>
> Indoor
>
>
>
>
>
>
>
>
> Particles
could you please suggest me the suitable pollen count or monitoring sensor which are available