a quick question to you
39 views
Skip to first unread message
![Li, Aiguo (NIH/NCI) [E]'s profile photo](http://lh3.googleusercontent.com/a-/ALV-UjWowr1uwEjUZAs_x3MhhOKxd6JN_xH5SkdItVUhPJZqDGES_Q=s40-c)
Li, Aiguo (NIH/NCI) [E]
Apr 14, 2016, 3:14:12 PM4/14/16
to gen...@soe.ucsc.edu
Dear all,
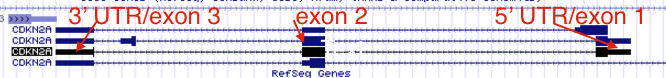
I assumed that in genome view the longer bar of a given gene indicates 3' end and short bar indicates 5' end. However, the attached CDKN2A gene has longer bars in both ends. Could you please help me to figure out which is the 5' and 3' of of this gene?
Thanks,
Anna

Cath Tyner
Apr 15, 2016, 4:47:40 PM4/15/16
to Li, Aiguo (NIH/NCI) [E], gen...@soe.ucsc.edu
Hello Anna,
Thank you for using the UCSC Genome Browser and for submitting your question regarding how to determine the 5' and 3' ends of a gene.
The length of the bar at the end of each gene is not related to defining the untranslated region
Here's a FAQ with some information:https://genome.ucsc.edu/FAQ/FAQtracks.html#tracks15
Specifically, note: "The thickest parts of the track indicate the coding exon regions within the gene. The slightly thinner portions at the leading and trailing ends of the gene track show the 5' and 3' UTRs." So, thick
In the browser, you can immediately see which end of the gene is 5' or 3' by looking at the tiny arrows (chevrons) along the line of the gene. In the genome browser, the direction of the chevrons indicates the direction of transcription. For a gene located on the positive strand, the chevrons
look like this: > > > > > , and the gene is displayed in a 5' to 3' direction. For a gene located on the negative strand, the chevrons look like this: < < < < < , and the gene is displayed in a 3' to 5' direction.
In the example image that you attached, if you click on the highlighted gene, you will go to
On this page, you will see the following information - look for the "Strand" information:
Transcript (Including UTRs)
Position: chr9:21,967,751-21,975,132 Size: 7,382 Total Exon Count: 3 Strand: -
Because the gene is located on the negative strand in the human genome, the CDKN2A gene is displayed in a 3' to 5' direction. The UTR on the left side of the screen is the 3' UTR, and the chevrons for the gene are displayed as: < < < <
Thank you for using the UCSC Genome Browser and for submitting your question regarding how to determine the 5' and 3' ends of a gene.
The length of the bar at the end of each gene is not related to defining the untranslated region
(
UTR)
; the length of the bar only represents the amount of exon sequence (some of which may be an untranslated region).
The height
of the bar represents whether or not this exon
sequence is an
UTR
.
Here's a FAQ with some information:https://genome.ucsc.edu/FAQ/FAQtracks.html#tracks15
Specifically, note: "The thickest parts of the track indicate the coding exon regions within the gene. The slightly thinner portions at the leading and trailing ends of the gene track show the 5' and 3' UTRs." So, thick
(tall blocks)
bars are exons, regardless of length, and slightly thinner (in height)
bars are exons, regardless of length.In the browser, you can immediately see which end of the gene is 5' or 3' by looking at the tiny arrows (chevrons) along the line of the gene. In the genome browser, the direction of the chevrons indicates the direction of transcription. For a gene located on the positive strand, the chevrons
look like this: > > > > > , and the gene is displayed in a 5' to 3' direction. For a gene located on the negative strand, the chevrons look like this: < < < < < , and the gene is displayed in a 3' to 5' direction.
In the example image that you attached, if you click on the highlighted gene, you will go to
the
gene description page.
On this page, you will see the following information - look for the "Strand" information:
Transcript (Including UTRs)
Position: chr9:21,967,751-21,975,132 Size: 7,382 Total Exon Count: 3 Strand: -
Because the gene is located on the negative strand in the human genome, the CDKN2A gene is displayed in a 3' to 5' direction. The UTR on the left side of the screen is the 3' UTR, and the chevrons for the gene are displayed as: < < < <
In the picture of the UCSC Browser view I've attached below, take a look at the thicker black bar at the right side (5') of the gene. The UTR is the thinner part of the black bar, and the thicker part of the black bar is the coding sequence (CDS) portion. Combined, the UTR region and the CDS region make up exon 1.
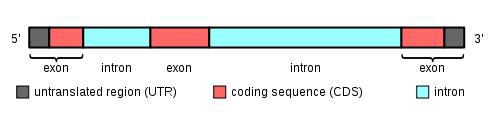
Below is a nice image from wikipedia's exon page (on the + strand if viewed in the browser):
In the browser image above, the thickest part of the black bar corresponds to the pink (CDS portion of this exon) region in the image below. The slightly-thinner black bar in the UCSC view is the UTR, corresponding to the gray region (UTR portion of this exon) in the picture below.
Thank you again for your inquiry and for using the UCSC Genome Browser.
Please send new and follow-up questions to one of our UCSC Genome Browser mailing lists below:
* Confidential/private data help: Email
genom...@soe.ucsc.eduEnjoy,
--
---
You received this message because you are subscribed to the Google Groups "UCSC Genome Browser discussion list" group.
To unsubscribe from this group and stop receiving emails from it, send an email to genome+un...@soe.ucsc.edu.
Reply all
Reply to author
Forward
0 new messages